Learn about the latest tips, tutorials, upcoming events and certifications
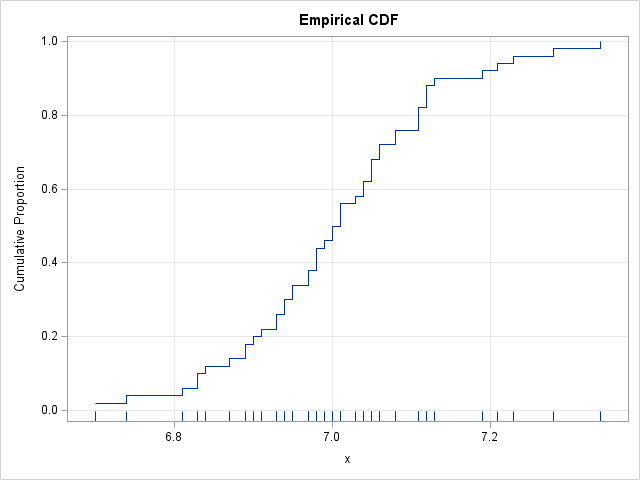
Create and graph the ECDF function in SAS

The empirical cumulative distribution function (ECDF) is an important tool in statistics. It is one of several plots you can use to visualize the shape of a data distribution. It is not used as often as the histogram, the kernel density estimate, and the box plot, but it is essential