Wilcoxon's signed rank test is a popular nonparametric alternative to a paired t test. In a paired t test, you analyze measurements for subjects before and after some treatment or intervention. You analyze the difference in the measurements for each subject, and test whether the mean difference is significantly different from 0. The test assumes that the distribution of the differences is normally distributed. Wilcoxon's signed rank test is similar. It tests whether the median difference is significantly different from 0. The signed rank test does not assume normality. However, it does assume that the distribution of the differences is symmetric.
Both the paired t test and the signed rank test are equivalent to a one-variable test that uses the difference between the two variables for each subject. Thus, they are univariate tests for the location parameter for the distribution of the difference. In SAS, you can use PROC UNIVARIATE to run both these tests.
A statistical programmer was trying compare the results of the Wilcoxon's signed rank test in SAS to results from a different statistical software package. The programmer was confused because the test statistics did not agree. This article shows that there are two different (but equivalent) statistics for the signed rank test. Ironically, SAS does not actually compute any "signed ranks" when it computes the eponymous test statistic!
The signed rank statistic: An example
First, let's run an example. The following data set is taken from the SAS documentation for PROC TTEST. The data are measurements of systolic blood pressure for 12 men in a study before and after a treatment. The research question is whether the treatment changes the men's blood pressure (BP). One way to answer the question is to ask whether the median BP after the treatment is different from than the median BP before the treatment. You can compute the difference in blood pressures for each man and run PROC UNIVARIATE to investigate whether the mean or median difference is 0:
/* data from the PROC TTEST documentation: https://go.documentation.sas.com/doc/en/pgmsascdc/v_021/statug/statug_ttest_examples03.htm Systolic blood pressures of 12 men before and after a treatment. */ data BP; input SBP_Before SBP_After @@; Diff = SBP_Before - SBP_After; /* manually compute the difference */ datalines; 120 128 124 131 130 131 118 127 140 132 128 125 140 141 135 137 126 118 130 132 126 129 127 135 ; proc univariate data=BP mu0=0; var Diff; ods select TestsForLocation; run; |
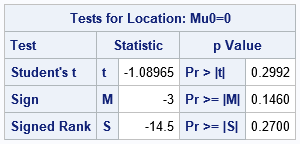
The output shows three statistical tests for the location parameter for the Diff variable. The null hypothesis is that that the location parameter is 0. The p-values are all relatively large, so the data does not provide evidence to reject the null hypothesis. The last row of the table shows the statistic for Wilcoxon's signed rank test. The value of the statistic for these data is -14.5. The next section explains how to compute the signed rank statistic.
The test statistic for the signed rank test in SAS
The documentation for PROC UNIVARIATE describes how to compute the statistics in the table. As noted earlier, the formula does not make any reference to the signed rank!
Although you could use PROC RANK and the SAS DATA step for this computation, it is easier to use SAS IML to compute the statistic. The steps are as follows:
- Exclude any observations for which the difference is exactly 0. Let nt be the count of the remaining observations.
- Define Ri as the rank of |xi - μ0|. Use average ranks for tied values. For this example, μ0-0. By default, the RANKTIE function in PROC IML uses tied ranks.
- Define T+ as the sum of the ranks for which xi > μ0.
- Compute the test statistic S = T+ – nt (nt +1) / 4.
You can implement this in PROC IML in a natural way:
proc iml; use BPDiff; read all var "Diff" into y; close; mu0 = 0; /* test statistic for Wilcoxon Signed Rank Test according to formula from PROC UNIVARIATE documentation */ start SignedRankTest_SAS(y, mu0=0); x = y - mu0; x = x[loc(x ^= 0)]; /* 1. Exclude if x=mu0 */ nT = nrow(x); /* count remaining obs */ R = ranktie(abs(x)); /* 2. Rank abs(x) with ties=MEAN */ idx = loc(x > 0); Tplus = sum(R[idx]); /* 3. Sum ranks for x > mu0 */ S = Tplus - nT*(nT+1)/4; /* 4. Test statistic for PROC UNIVARIATE */ return S; finish; /* compute test statistic used in PROC UNIVARIATE */ S = SignedRankTest_SAS(y, mu0); print "Signed Rank Test: S = " S; |
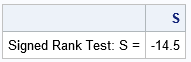
This manual computation of the test statistic matches the output from PROC UNIVARIATE.
An alternative test statistic for the signed rank test
As mentioned earlier, this computation does not actually use the signed ranks of the data. So, what is going on? Well, there are two equivalent statistics for this test. The Wikipedia article discusses the statistic that uses the signed ranks. The algorithm is as follows:
- Exclude any observations for which the difference is exactly 0.
- Define Ri as the rank of |xi - μ0|. Use average ranks for tied values.
- Compute the test statistic T as the sum of the signed ranks, sign(xi) Ri.
Again, you can implement this in PROC IML:
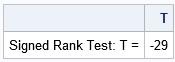
/* The signed rank formula in Wikipedia is a different statistic, T = sum of the signed ranks */ start SignedRankTest(y, mu0=0); x = y - mu0; SR = j(nrow(x), 1, 0); /* allocate vector; assign 0 if x=mu0 */ idx = loc(x ^= 0); /* 1. Exclude if x=mu0 */ SR[idx] = sign(x[idx])#ranktie(abs(x[idx])); /* 2. Signed ranks of abs(x) */ T = sum(SR); /* 3. test statistic is sum of signed ranks */ return T; finish; T = SignedRankTest(y, mu0); print "Signed Rank Test: T = " T; |
Why the test statistics are equivalent
Notice that the T statistic (from Wikipedia) is twice the value of the S statistic (from PROC UNIVARIATE). This is not a coincidence; this is always the case. The Wikipedia article notes that the sum of the signed ranks (T) is related to the "positive-rank sum" (T+) according to the formula T+ = T/2 + nT(nT+1)/4. Because the test statistic, S, is defined by S = T+ – nT*(nT+1)/4, we obtain S = T/2 or, equivalently, T = 2S.
As a result of this relationship, you can use either S or T as a test statistic. The distribution of S is merely a scaled version of the distribution of T. By accounting for the scaling factor, you can convert quantiles and p-values of S into the analogous quantities for T, and vice versa.
There are additional ways to define the test statistic. The main point of this article is that there are multiple ways to define the test statistic for the Wilcoxon signed rank test, so the test statistic might be different when you use different software packages.
Summary
A SAS programmer noticed that the results of the Wilcoxon signed rank test was different between SAS and another statistical software package. The resolution of this issue is that there are two popular statistics that you can use to construct the signed rank test. The one that uses the sum of signed ranks (T) is twice the value of the "positive-rank sum" statistic (S), which is what SAS uses. Because the distribution of T is a scaled version of the distribution of S, you can use either statistic for hypothesis tests.

1 Comment
Pingback: Modifications of the Wilcoxon signed rank test and exact p-values - The DO Loop