The DO Loop
Statistical programming in SAS with an emphasis on SAS/IML programs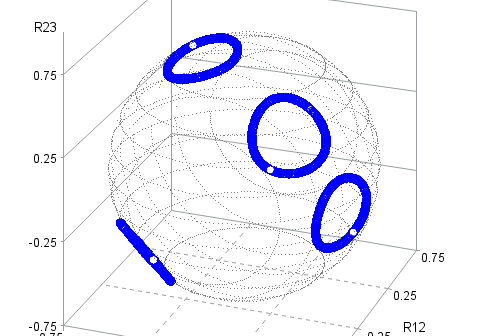

In a previous article, I implemented an algorithm due to Niels Waller (TAS, 2020) that uses the method of alternating projections (MAP) to generate random correlation matrices that have a specified set of eigenvalues. The algorithm is iterative, and the MAP method is not guaranteed to converge, although Waller claims

I've been working on a project that uses quasi-Monte Carlo (QMC) techniques to estimate probabilities for multivariate normal (MVN) distributions on finite or infinite rectangular regions. The goal is to enable SAS users to compute these probabilities accurately and efficiently. My implementation is based on a numerical technique called the
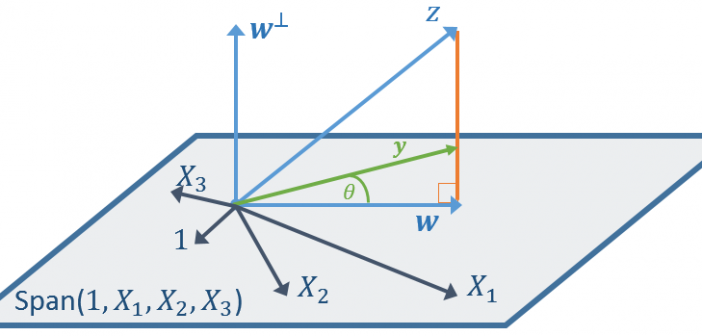
One of the great algorithms of linear algebra is the Gram-Schmidt orthogonalization process, which enables you to construct an orthogonal basis for a linear subspace from any set of linearly independent vectors that span the subspace. The Gram-Schmidt process is the basis for the QR decomposition in numerical linear algebra,