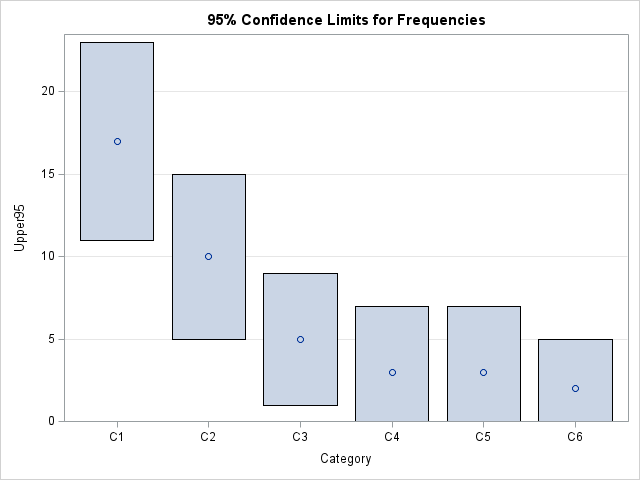
Confidence limits for counts in a multinomial distribution

A recent article discussed Pareto charts and how to create them in SAS. A Pareto chart is used in quality control to identify the most likely reasons that a manufacturing process produces defective items. Suppose there are k different reasons why a process can fail, and you intend to randomly