The world’s largest rugby tournament returns for the knockout stages. This blog post explores how probability and simulation can be used to predict likely winners in each of the knockout stages. Team sports are dynamic, time-varying and complex topics to model.
When modeling regular competitions, such as domestic leagues, it is possible to model the outcome of individual fixtures as we often have many observations from teams regularly playing each other. International rugby, however, has reasonably sparse data.
Teams often do not play each other for many years. Combining probability models with simulations offers a proxy measure to estimate fixture outcomes where we have no observations between sides.
Related: French national rugby team boosts performance with AI and analytics
Building a simulation model
The model is split into two parts:
- First, a hierarchical Bayesian model to estimate the “win rate” (i.e., the likelihood of winning a given fixture) for sides playing in the tournament.
- Second, randomly sampling from the estimated win rates to compare win probability for pool and knockout fixtures simulating the tournament.
While the model is imperfect, it gives a useful insight into which sides are likely to dominate the competition based on recent form.
Running the simulations
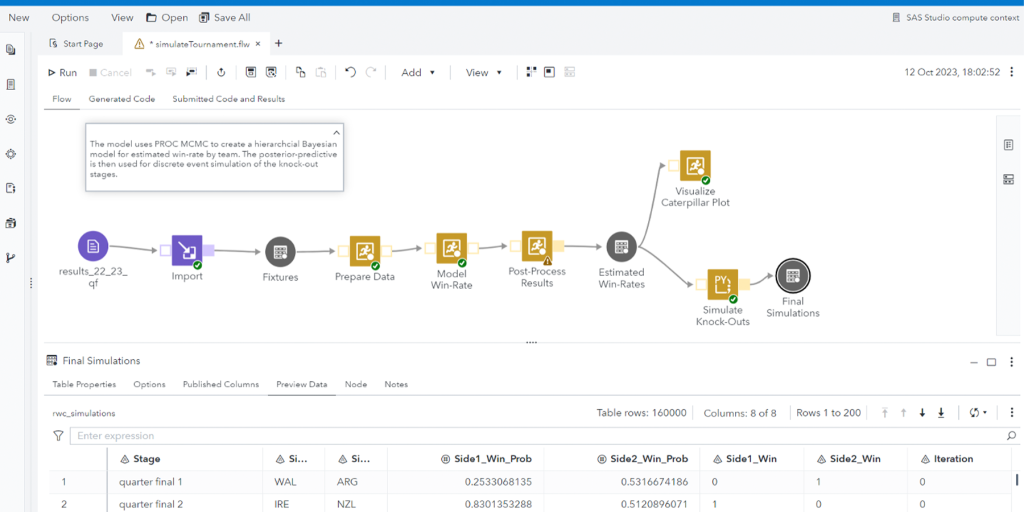
The simulations were run using a SAS Studio flow. The flow first loads and transforms international fixture results since 2022. We then use these fixture results to run our Bayesian model for estimating win rates. Finally, we use a Python code node to run discrete event simulation, which randomly samples win rates to simulate the knockout stages 20,000 times.
Updating our model
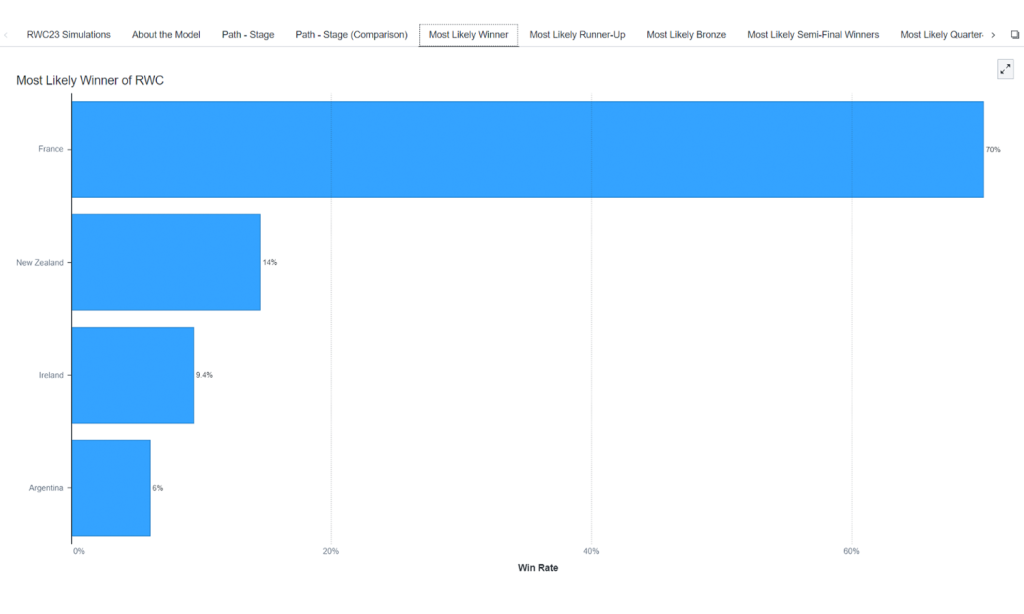
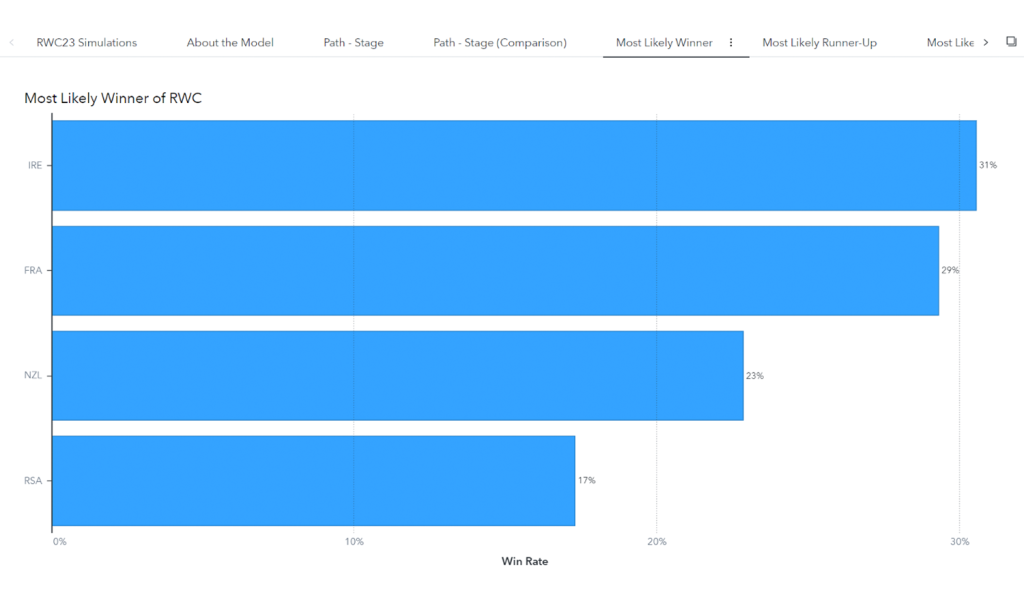
I ran the model before the tournament began and have since updated the model with the results of the pool stages to compare how the predictions for the knockout stages have changed. Figure 2 shows that based on recent form, France went into the tournament as strong favorites to win as they won the tournament in 70% of simulations. Figure 3 shows that since the pool results have come in, Ireland and France are close favorites to win the tournament each with odds of approximately 3-1.
Visualizing simulated pathways
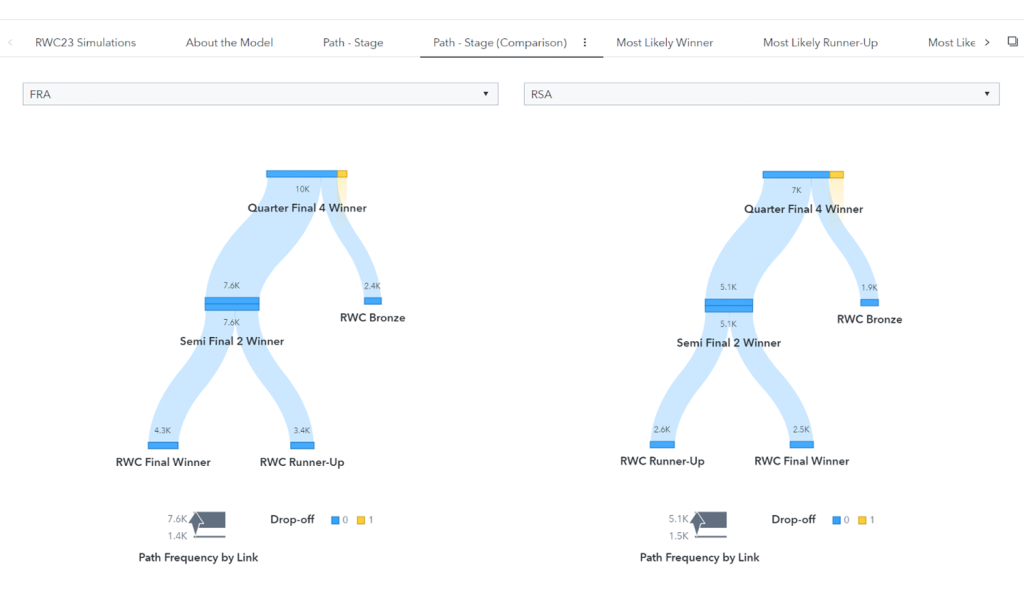
One benefit of simulation modeling is that you generate a rich data set that you can use for scenario analysis and planning. Figure 4 shows how we can take the simulations and represent them via a path analysis in SAS Visual Analytics to compare likely tournament pathways. Here, we can see that France is likely to knock South Africa out of the competition. If South Africa wins the fixture they are more likely to be tournament runner-up than winner, whereas if France wins in the quarterfinals they are more likely to win the tournament overall rather than place second or third.
Current tournament predictions
Based on the pool results combined with previous fixtures used in the original simulations, the model now predicts the below odds for the overall winner:
- France, 7-2.
- Ireland, 7-2.
- New Zealand, 5-1.
- South Africa, 13-2.
Predictions for knockout round?
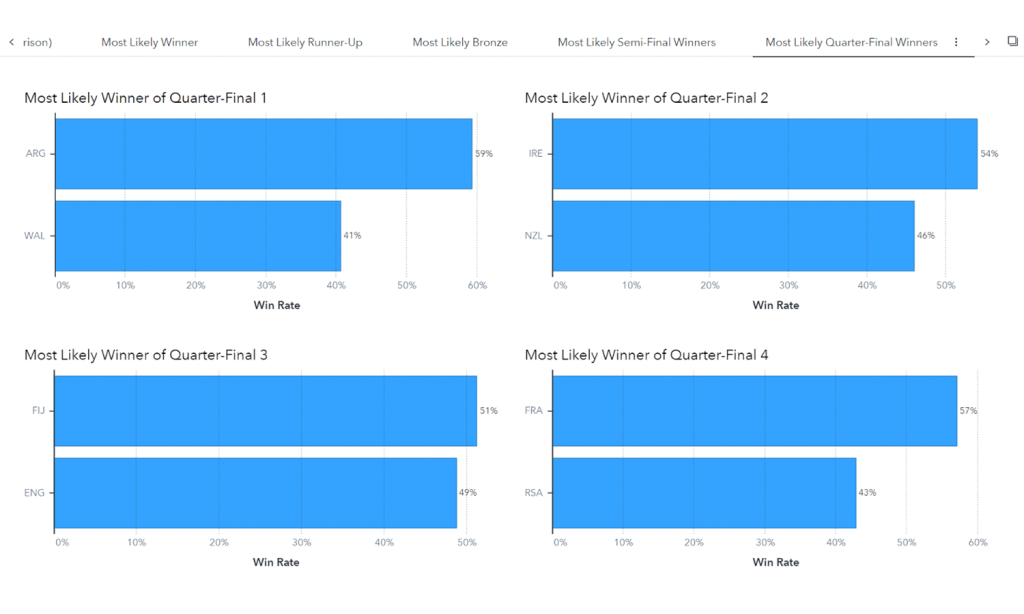
The predictions for the knockout round, as shown in Figure 5, show that:
- Argentina beat Wales 59% of the time.
- Ireland beat New Zealand 54% of the time.
- Fiji beat England 51% of the time.
- France beat South Africa 57% of the time.
The model is imperfect, of course, as it only takes into consideration past results. Both Argentina and Fiji have shown good form recently. The model cannot take into consideration injuries or playing styles, for example.
How does this compare to bookmaker’s odds?
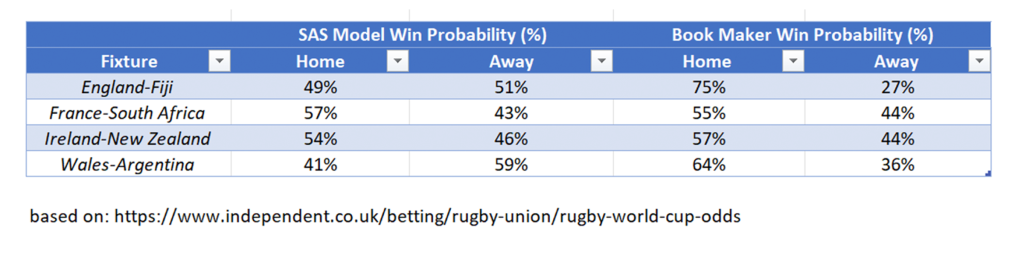
Much like with time series forecasting, the most accurate predictions will be for the next period. Figure 6 shows our simulation model’s predictions for the quarterfinals to be played this weekend. Next to our SAS model results, Figure 6 shows some publicly advertised bookmaker odds that have been converted to probabilities.
Our model agrees with the bookmaker for both the France and Ireland fixtures, but it is reasonably different for the England and Wales fixtures. The bookmakers put a high probability on England winning (though these odds may be generous to entice customers) and likewise, Wales has an edge over Argentina.
We’ve seen how a combination of probabilistic analysis and simulation can be used to set expectations for performance in the Rugby World Cup despite having only sparse observations readily available. The model has picked clear favorites in France and Ireland to win the tournament while New Zealand and South Africa still have a strong chance of winning. The model, while imperfect, does appear to capture the recent form of sides and for the upcoming quarterfinals, the simulations produce win probabilities that are comparable to official bookmaker odds.
See how the French national rugby team boosts performance with AI and analytics.
If you enjoyed this …
Check out some of my other blogs that explore sports, simulation or Bayesian analysis:
Selecting the starting lineup of the British & Irish Lions using optimization techniques
Finding a sunken vessel using Bayesian search theory
Understanding the likelihood of children sharing the same name at school with Bayes theorem