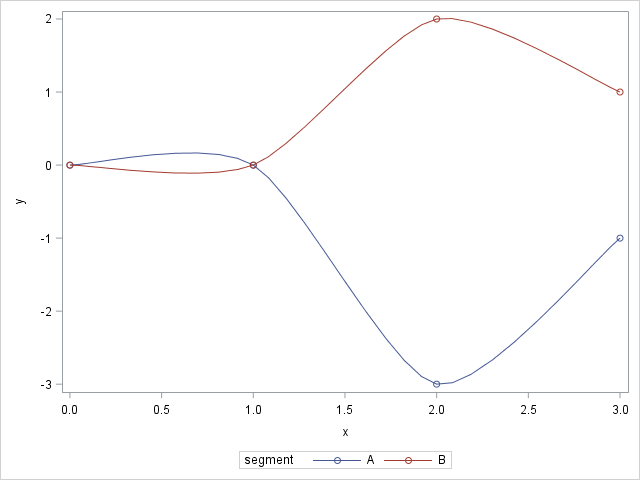
Tag: 13.1

Rick Wicklin 0
Overlay plots on a box plot in SAS: Discrete X axis

Box plots summarize the distribution of a continuous variable. You can display multiple box plots in a single graph by specifying a categorical variable. The resulting graph shows the distribution of subpopulations, such as different experimental groups. In the SGPLOT procedure, you can use the CATEGORY= option on the VBOX

Rick Wicklin 0
The WHERE clause in SAS/IML

In SAS procedures, the WHERE clause is a useful way to filter observations so that the procedure receives only a subset of the data to analyze. The IML procedure supports the WHERE clause in two separate statements. On the USE statement, the WHERE clause acts as a global filter. The

Rick Wicklin 0
What is the coefficient of variation?

I sometimes wonder whether some functions and options in SAS software ever get used. Last week I was reviewing new features that were added to SAS/IML 13.1. One of the new functions is the CV function, which computes the sample coefficient of variation for data. Maybe it is just me,

Rick Wicklin 0
Does this kurtosis make my tail look fat?

What is kurtosis? What does negative or positive kurtosis mean, and why should you care? How do you compute kurtosis in SAS software? It is not clear from the definition of kurtosis what (if anything) kurtosis tells us about the shape of a distribution, or why kurtosis is relevant to

Rick Wicklin 0
Create discrete heat maps in SAS/IML

In a previous article I introduced the HEATMAPCONT subroutine in SAS/IML 13.1, which makes it easy to visualize matrices by using heat maps with continuous color ramps. This article introduces a companion subroutine. The HEATMAPDISC subroutine, which also requires SAS/IML 13.1, is designed to visualize matrices that have a small

Rick Wicklin 0
Skew this

The skewness of a distribution indicates whether a distribution is symmetric or not. A distribution that is symmetric about its mean has zero skewness. In contrast, if the right tail of a unimodal distribution has more mass than the left tail, then the distribution is said to be "right skewed"

Rick Wicklin 0
Creating heat maps in SAS/IML

In a previous blog post, I showed how to use the graph template language (GTL) in SAS to create heat maps with a continuous color ramp. SAS/IML 13.1 includes the HEATMAPCONT subroutine, which makes it easy to create heat maps with continuous color ramps from SAS/IML matrices. Typical usage includes

Rick Wicklin 0
Video: What's new in SAS/IML 13.1

SAS/IML 13.1 shipped a few months ago. I was asked to produce a video that highlights some of the new features in SAS/IML 13.1. In this video I describe several changes to the language before introducing the new built-in subroutines that create ODS statistical graphs. If your browser does not

Rick Wicklin 0
Say hello to SAS Analytics 13.1

Late last month, while many of us were sipping eggnog and decking halls with boughs of holly, SAS released the 13.1 version of its analytical products. Readers of Maura Stokes' newsletter, SAS Statistics and Operations Research News (Nov 2013), have already been alerted to new features in products such as

Rick Wicklin 0
What versions of R are supported by SAS?

SAS 9 has supported calling R from the SAS/IML language since 2009. The interface to R is part of the SAS/IML language. However, there have been so many versions of SAS and R since 2009, that it is hard to remember which SAS release supports which versions of R. The