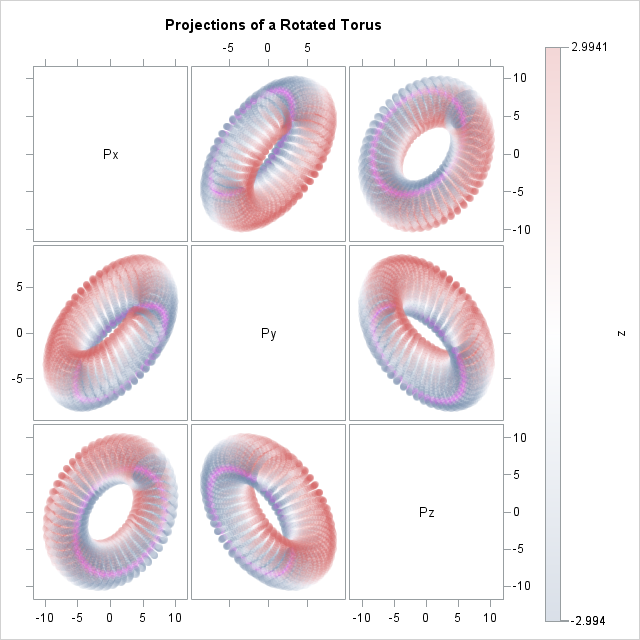
This article uses graphical techniques to visualize one of my favorite geometric objects: the surface of a three-dimensional torus. Along the way, this article demonstrates techniques that are useful for visualizing more mundane 3-D point clouds that arise in statistical data analysis. Define points on a torus A torus is
Tag: SAS/IML Studio
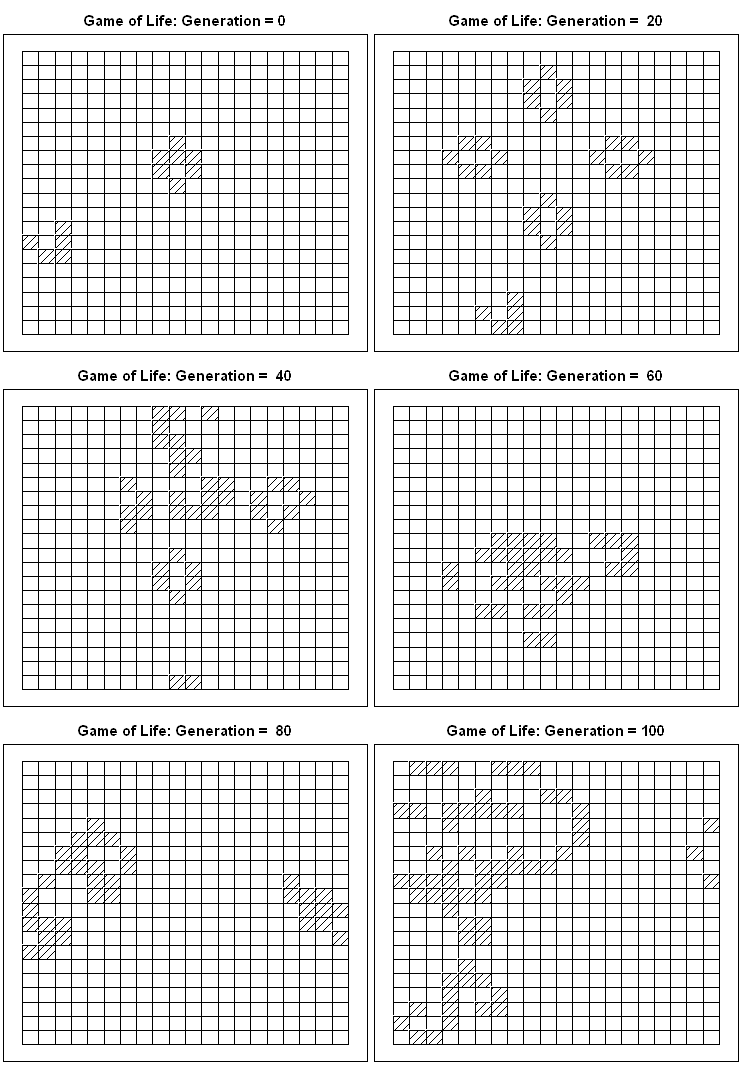
A colleague jokingly teases me whenever I write a blog that demonstrates how to write fun and exciting programs by using SAS software. "Why do you get to have all the fun?" he mock-chides. Today I'm ready to face his ribbing, because this article is about Conway's Game of Life
Today is my 500th blog post for The DO Loop. I decided to celebrate by doing what I always do: discuss a statistical problem and show how to solve it by writing a program in SAS. Two ways to parameterize the lognormal distribution I recently blogged about the relationship between
SAS 9 has supported calling R from the SAS/IML language since 2009. The interface to R is part of the SAS/IML language. However, there have been so many versions of SAS and R since 2009, that it is hard to remember which SAS release supports which versions of R. The
Last week I presented two talks at the University of Wisconsin at Milwaukee, which has established a new Graduate Certificate in Applied Data Analysis Using SAS. While in Milwaukee, I ran into an old friend: the ODS LISTING destination. One of my presentations was a hands-on workshop titled Getting Started
I am pleased to announce that the documentation for the IMLPlus language is now available online. Previously, this resource was available only from within the SAS/IML Studio application. This documentation can now be accessed by anyone, regardless of whether they have installed SAS/IML Studio. As I have described previously, IMLPlus
NOTE: SAS stopped shipping the SAS/IML Studio interface in 2018. It is no longer supported, so this article is no longer relevant. When I write SAS/IML programs, I usually do my development in the SAS/IML Studio environment. Why? There are many reasons, but the one that I will discuss today
For years I've been making presentations about SAS/IML software at conferences. Since 2008, I've always mentioned to SAS customers that they can call R from within SAS/IML software. (This feature was introduced in SAS/IML Studio 3.2 and was added to the IML procedure in SAS/IML 9.22.) I also included a
I was inspired by Chris Hemedinger's blog posts about his daughter's science fair project. Explaining statistics to a pre-teenager can be a humbling experience. My 11-year-old son likes science. He recently set about trying to measure which of three projectile launchers is the most accurate. I think he wanted to
If you tell my wife that she's married to a statistical geek, she'll nod knowingly. She is used to hearing sweet words of affection such as You are more beautiful than Euler's identity. or My love for you is like the exponential function: increasing, unbounded, and transcendental. But those are
Last week I generated two kinds of random point patterns: one from the uniform distribution on a two-dimensional rectangle, the other by jittering a regular grid by a small amount. My show choir director liked the second method (jittering) better because of the way it looks on stage: there are
Computing probabilities can be tricky. And if you are a statistician and you get them wrong, you feel pretty foolish. That's why I like to run a quick simulation just to make sure that the numbers that I think are correct are, in fact, correct. My last post of 2010
When I finished writing my book, Statistical Programming with SAS/IML Software, I was elated. However, one small task still remained. I had to write the index. How Long Should an Index Be? My editor told me that SAS Press would send the manuscript to a professional editor who would index
NOTE: SAS stopped shipping the SAS/IML Studio interface in 2018. The references in this article to IMLPlus and SAS/IML Studio are no longer relevant. There are three kinds of programming errors: parse-time errors, run-time errors, and logical errors. It doesn't matter what language you are using (SAS/IML, MATLAB, R, C/C++,
I give many presentations and workshops on how to use SAS/IML Studio, and more than once I have been asked about how to launch the program. Sometimes the inquiry hints at mild frustration, such as last week's "How do I RUN the $%#@# THING!!!!" The email I got this week
Today I'm in San Diego at the 2010 meeting of the Western Users of SAS Software (WUSS). I am giving several presentations on SAS/IML and SAS/IML Studio: A tutorial workshop on SAS/IML Studio for the SAS/STAT User. The material in this tutorial is a small sampling of Chapters 4–11 of
The IMLPlus language has been available to SAS customers since 2002, but there are still many people who have never heard of it. What is IMLPlus? The documentation SAS/IML Studio for SAS/STAT Users says this about IMLPlus: The programming language in SAS/IML Studio, which is called IMLPlus, is an enhanced
Visualizing the distribution of data is a primary task of data analysis. With all the hurricane activity in the Atlantic this year, I’ve been thinking about ways to visualize the historical distribution of hurricane activity. USA Today on Friday, August 13, 2010, announced that "the heart of hurricane season is