This article uses graphical techniques to visualize one of my favorite geometric objects: the surface of a three-dimensional torus. Along the way, this article demonstrates techniques that are useful for visualizing more mundane 3-D point clouds that arise in statistical data analysis.
Projections of a 3-D torus: Four visualization techniques for high-dimensional data. #DataViz Share on XDefine points on a torus
A torus is the product of two circles, so it can be parameterized by two angles, usually called θ and φ. You can create a regular grid of points in the square (θ, φ) ∈ [0, 2π] x [0, 2π] and map the points into Euclidean three-space as shown in the following SAS DATA step:
data Torus; R = 8; /* radius to center of tube */ A = 3; /* radius of tube */ pi = constant('pi'); step = 2*pi/50; /* create torus as parametric image of [0, 2*pi] x [0,2*pi] */ do theta = 0 to 2*pi-step by step; do phi = 0 to 2*pi-step by 2*pi/50; x = (R + A*cos(phi)) * cos(theta); y = (R + A*cos(phi)) * sin(theta); z = A*sin(phi); output; end; end; keep x y z; run; title "Projections of a Standard Torus"; proc sgscatter data=Torus; matrix x y z; run; |
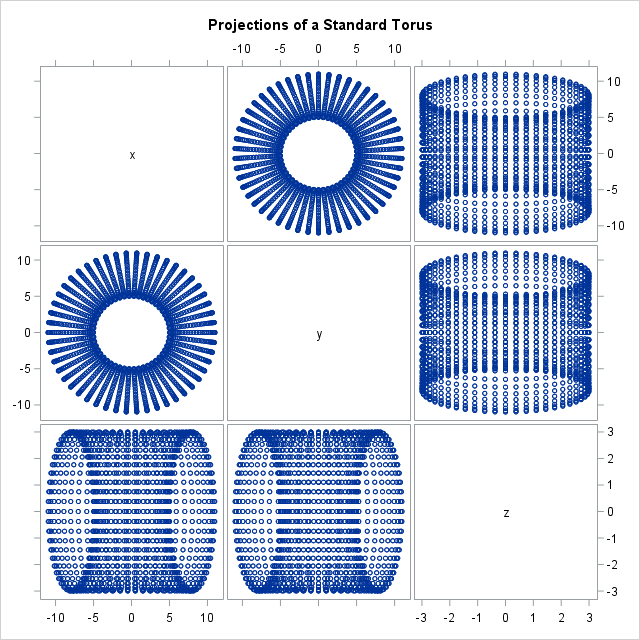
The SGSCATTER procedure displays the projection of the torus onto the three coordinate planes. In the (x,y) plane you can see that the object has a hole, but the projection onto the other coordinate planes are not very insightful because there is a lot of overplotting.
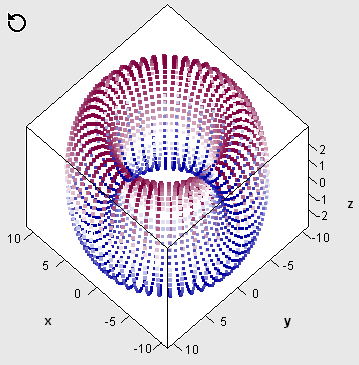
One way to avoid overplotting is to visualize the torus as a 3-D cloud of points. The SAS/IML Studio environment supports a rotating 3-D scatter plot, as shown to the left. In SAS/IML Studio you can interactively rotate the 3-D cloud of points, change the marker colors, and perform other techniques in exploratory data analysis.
Alternatively, if you want to look at planar projections with PROC SGSCATTER, you can rotate the torus so that the projections onto the coordinate planes are not degenerate.
Rotating a cloud of points
My previous article defined SAS/IML functions that create rotation matrices. The following SAS/IML program is almost identical to the program in the previous article, so I will not explain each statement. The program reads the Torus data set, rotates the points in a particular way, and writes the rotated coordinates to a SAS data set.
proc iml; /* choose rotation matrix as product of canonical rotations */ load module=Rot3D; /* see https://blogs.sas.com/content/iml/2016/11/07/rotations-3d-data.html */ pi = constant('pi'); Rz = Rot3D(-pi/6, "Z"); /* rotation matrix for (x,y) plane */ Rx = Rot3D(-pi/3, "X"); /* rotation matrix for (y,z) plane */ Ry = Rot3D( pi/6, "Y"); /* rotation matrix for (x,z) plane */ P = Rx*Ry*Rz; /* cumulative rotation */ use Torus; /* read data (points on a torus) */ read all var {x y z} into M; close Torus; Rot = M * P`; /* apply rotation and write to data set */ create RotTorus from Rot[colname={"Px" "Py" "Pz"}]; append from Rot; close; QUIT; |
You can use PROC SGSCATTER to project these rotated points onto the coordinate planes. The TRANSPARENCY= option creates semi-transparent markers that give the illusion of a ghostly see-through torus. This can be an effective technique for visualizing any point cloud, since it enables you to see regions in which overplotting occurs. The statements also use the COLORRESPONSE= option to color the markers by the (original) Z variable. The COLORRESPONSE= option requires SAS 9.4m3.
data Coords; merge Torus RotTorus; run; title "Projections of a Rotated Torus"; proc sgscatter data=Coords; matrix Px Py Pz / markerattrs=(size=12 symbol=CircleFilled) transparency=0.75 colorresponse=Z colormodel=ThreeColorRamp; /* COLORRESPONSE= requires 9.4m3 */ run; |
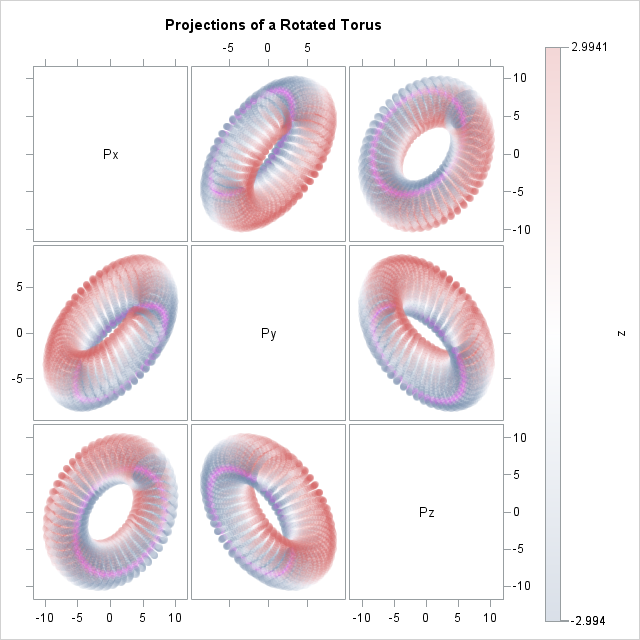
The transparent markers serve a second function. The torus is composed of a sequence of circles. Therefore, the last circles (near θ = 2π) will obscure the first circles (near θ = 0) if opaque markers are used. The parametric construction is very apparent if you remove the TRANSPARENCY= option.
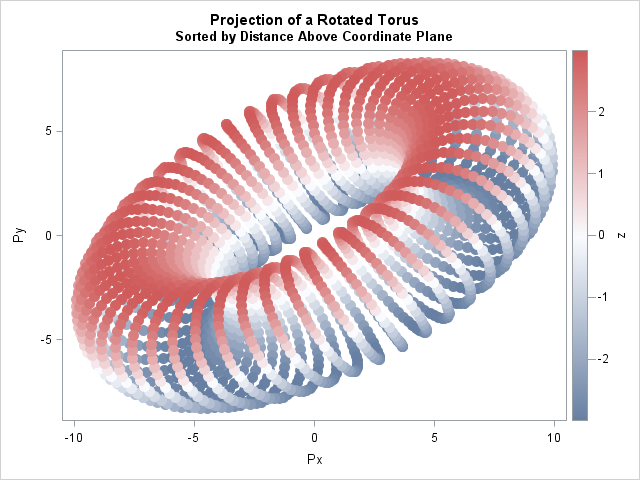
If you want to plot without transparency, you should sort the data, which is a standard technique in the graphics community where it is called z-ordering or depth sorting. For example, in the (Px,Py) plane you can sort by the Pz variable so that negative Pz values are plotted first and positive Pz values are plotted on top of the earlier markers. Unfortunately, you can only use this sorting trick to plot one pair of coordinates at a time. The following code demonstrates this trick for the (Px, Py) plane:
proc sort data=Coords out=SortCoords; by Pz; run; title "Projection of a Rotated Torus"; title2 "Sorted by Distance Above Coordinate Plane"; proc sgplot data=SortCoords; scatter x=Px y=Py / markerattrs=(size=12 symbol=CircleFilled) colorresponse=Z colormodel=ThreeColorRamp; run; |
In conclusion, PROC SGSCATTER enables you to visualize high-dimensional data via projections onto coordinate planes. I demonstrated the techniques on a 3-D torus, but the techniques apply generally to any high-dimensional data. Visualization tricks in this article include:
- If the projections of the data onto coordinate planes are degenerate, rotate the points.
- Use semi-transparency to reduce the effect of overplotting.
- Use the COLORRESPONSE= option to color the markers by one of the variables. This requires SAS 9.4m4.
- If you do not want to use transparency, sort the data in a direction perpendicular to the projected plane. That makes the rendering look more realistic.
Your high-dimensional point clouds might not look as cool as this torus, but if you use these visualization tips, the data will be easier to interpret and understand. The SGSCATTER procedure in SAS is an easy-to-use routine for investigating relationships among several variables.

3 Comments
Very cool visualization. Next step - animation.
Bonsoir.
Comment obtenir le nuage de point de la projection d'un tore sur un plan avec python?
Merci
Posez votre question sur un forum Python.