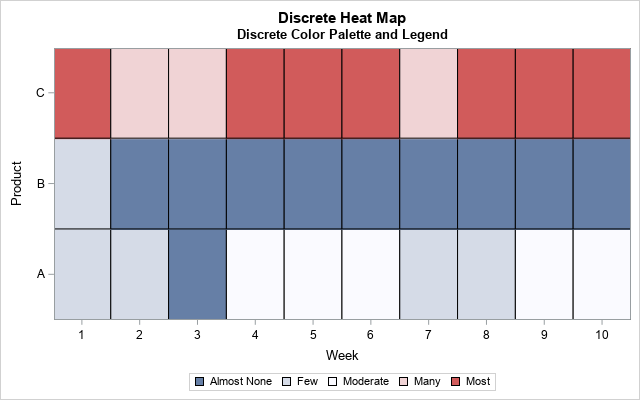
Create a discrete heat map with PROC SGPLOT

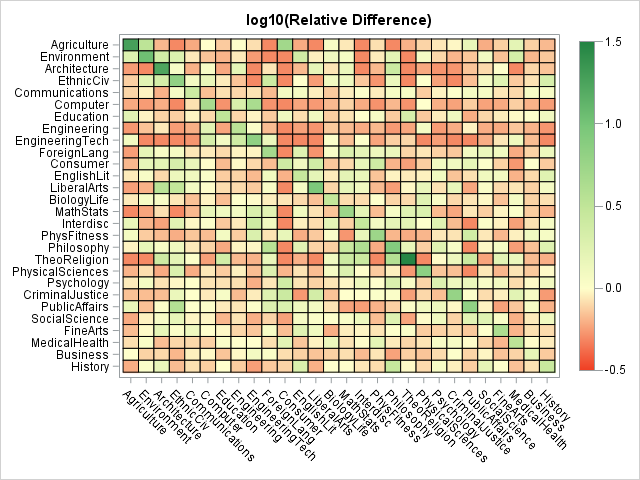
Heat maps have many uses. You can use a heat map to visualize correlation matrices, to visualize longitudinal data ("lasagna plots"), and to visualize counts in any two-dimensional table. As of SAS 9.4m3, you can create heat maps in SAS by using the HEATMAP and HEATMAPPARM statements in PROC SGPLOT.