In last week's article about the distribution of letters in an English corpus, I presented research results by Peter Norvig who used Google's digitized library and tabulated the frequency of each letter. Norvig also tabulated the frequency of bigrams, which are pairs of letters that appear consecutively within a word. This article uses SAS to visualize the distribution of bigram frequencies.
Cryptanalysts use the frequency of bigrams as part of a statistical analysis of an encrypted. Certain pairs of letter appear more frequently than others. For example, TH, HE, IN, and ER are pairs of letters that appear most frequently in the 744 billion words that Norvig analyzed.
You can download the SAS program that contains the data and creates all the graphs for this article.
The frequency distribution of bigrams
Norvig tabulated the frequencies of each bigram in the corpus. I created a SAS data set named Bigrams that contains the data. The following SAS/IML statements read the data into a 26 x 26 matrix, which is then transposed so that I can visualize it later by using a heat map. In order to distinguish between bigrams that occur rarely (FC in briefcase; YF in boyfriend) from bigrams that never or almost never appear (JT, QW, ZB,...), I assign a missing value to any bigram that appeared in the corpus less than 0.001% of the time. I then create an index vector (idx) that sorts the bigrams in descending order. I then call the SCATTER subroutine to visualize the frequency distribution of the bigrams:
proc iml;
use Bigrams; read all var {"Prop"}; close;
M = T( shape(Prop, 26, 26) );      /* reshape and transpose data into matrix */
M[loc(M=0)] = .;                   /* replace structural zeros with missing */
V = colvec(M);                     /* vector of proportions */
call sortndx(idx, V, 1) descend=1; /* idx sorts V in descending order */

/* scatter plot of all frequencies */
title "Relative Frequency of All Bigrams";
ods graphics / width=800 height=500;
N = countN(M);                    /* count of nonmissing proportions */
call scatter(1:N, V[idx[1:N]]) grid={x y} label={"Rank" "Proportion"}; |
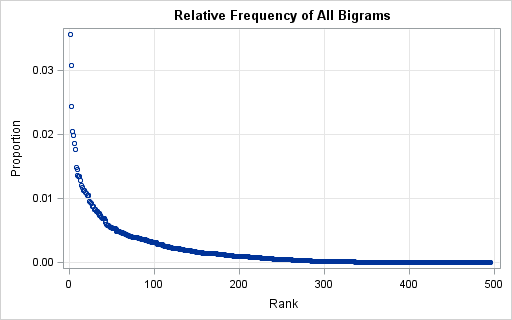
The scatter plot shows the relative frequencies of 495 bigrams that appear in the corpus. There are 23 bigrams that appear more than 1% of the time. The top 100 bigrams are responsible for about 76% of the bigram frequency. The distribution has a long tail. Bigrams like OX (number 300, 0.019%) and DT (number 400, 0.003%) do not appear in many words, but they appear often enough to make the list.
To a cryptanalyst, the important part of the plot is that there are a small number of bigrams that appear more frequently than others. That means that if you are trying to decrypt a coded message (or solve the daily Cryptoquote!), you can use frequency analysis of bigrams to help crack a simple substitution cipher. The following statements create a scatter plot of the top 23 bigrams and label each marker by the bigram it represents:
Letters = "A":"Z";                             /* labels */
Pairs = rowcat(expandgrid(Letters, Letters));  /* all 26 x 26 pairs */

/* scatter plot of top bigrams */
TopN = ncol(loc(M>=0.01));            /* count of proportion > 0.01 */
TopIdx = idx[1:TopN];
TopPairs = Pairs[TopIdx];
title "Bigrams with Relative Frequency > 1%";
call scatter(1:TopN, V[TopIdx]) grid={x y}
            label={"Rank" "Proportion"} datalabel=TopPairs;
print (T(V[TopIdx]))[c=TopPairs L="Top Bigrams" F=percent7.2]; |
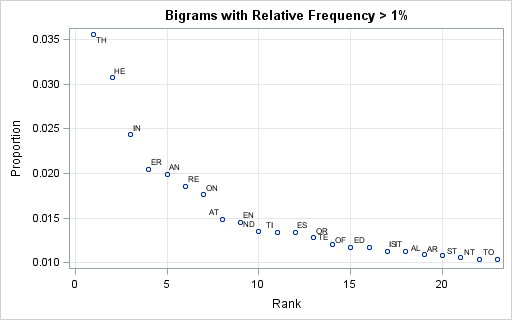
The top bigrams are shown in the scatter plot to the left. Click to enlarge the graph. The bigram TH is by far the most common bigram, accounting for 3.5% of the total bigrams in the corpus. The bigram HE, which is the second half of the common word THE, is the next most frequent. The next most frequently occurring bigrams are IN, ER, AN, RE, and ON.

A continuous heat map of the proportions of bigrams
Creating a plot or printing out the top bigrams is useful, but as a statistician I am also interested in visualizing the frequency distribution of all 26 x 26 bigrams in a way that makes it clear whether a particular bigram is common, rare, or impossible. The best concise visualization of that information is a heat map of the 26 x 26 matrix of proportions.
By using the new HEATMAPCONT subroutine in SAS/IML 13.1, you can create heat maps that use a continuous color ramp to show values in a matrix. The following statement creates a heat map of the bigram proportions:
/* heat map of bigram frequency with continuous color ramp */
ods graphics / width = 900 height=800;
call HeatmapCont(M) xValues=Letters yValues=Letters
xaxistop=1 legendtitle="Proportion"; |
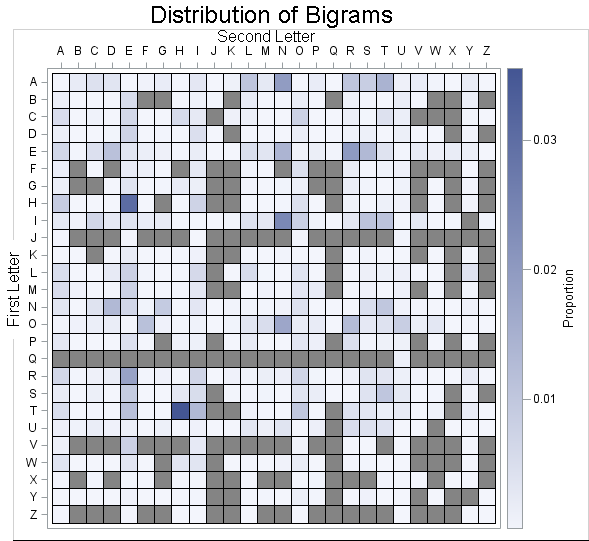
The relative frequencies are encoded by using the default two-color color ramp. The grey cells are bigrams that were not found in the corpus or were extremely rare. To find a particular bigram, trace down the heat map to find the row that corresponds to the first letter, then trace over until you reach the column of the second letter. Here are some observations about the relative frequencies of bigrams:
- The vowels associate with almost all letters. Only the bigrams IY, UQ, and UW were not found in the corpus when a vowel is the first letter of a bigram. For bigrams that have a vowel as the second letter, only QA, QE, QI, and QO were not found in the corpus.
- Vowels begin more than half of the most common bigrams.
- The consonants N and R start many bigrams. All possible bigrams that begin with these consonants were found in the corpus. The consonants D and S are also frequently found at the beginning of a bigram. The consonants L, H, R, S, and T are often found as the second letter in a bigram. It surprised me that there are so many bigrams with H as the second letter. I can't think of many words that contain BH (abhor), DH (adhere), or HH (hitchhiker).
- The letters J, Q, V, X, and Z have only a few friends that they hang out with. There are few bigrams that begin or end with those letters.
- Some letters like to lead, other like to follow. The letter K is a leader: it begins bigrams frequently, but is less likely to follow another letter. In contrast, the letter F is happy follow other letters, but is reluctant to take the lead.
The heat map visually emphasizes the most frequent and the impossible bigrams. If you want to see the very rare bigrams, create a heat map of the log-counts. You can also bin the values in the matrix and use a discrete set of colors to visualize the data. Both of these ideas are implemented in the SAS program for this article.
What interesting facts about bigrams can you find in the heat map? Are there any common or rare bigrams that surprise you? Leave a comment.

10 Comments
My senior project (too many years ago to recall) as a math major was on cryptanalysis. If only I'd had this resource then! But I was able to demonstrate the near-impossibility of factoring large primes by starting Mathematica running at the beginning of my presentation, and it hadn't factored the number by the end of the presentation - and it wasn't *that* big a number!
Love this series! Can't wait to see the next installment.
I was delighted to read your recent blog employing a "heat map" to visually present digram frequency data, obtained from Norvig"s update of my 1965 tables. Since you indicate you plan to continue this type of analysis, may I suggest that it might be highly useful and instructive to apply this technique, not just to the total digram frequency counts, as you have done, but also to those frequency columns in the tables which are "KEYED OFF" of word length and letter position. If you were to do this with the Norvig tables you would have 36 additional "heat maps", providing easy visual comparisons relating to word length and letter position combinations, which have proved to be highly significant components for research, since the publication of my original tables. Also, do you plan to go beyond digrams to trigrams, tetragrams, pentagrams etc., all of which would have significant implications for cryptanalysis.
I look forward to your reaction to these suggestions.
Dear Dr. Mayzner,
It is an honor to have you comment on my blog. Your suggestions are excellent, but I doubt that I will address them. The primary purpose of my blog is to show how to use SAS software to accomplish interesting tasks in statistical programming, data analysis, and data visualization. I avoid analyzing any topic too deeply because I want my posts to be accessible to non-experts. (And on this topic, I am a non-expert myself!)
For this series, I intend to explore repeated-letter bigrams and then discuss how to use frequency analysis of those three items (single letters, bigrams, and repeated letters) to solve simple recreational puzzles that appear in the daily newspaper. I do not intend to treat trigrams or higher combinations of letters at this time.
Best wishes,
Rick Wicklin
Pingback: Which double letters appear most frequently in English text? - The DO Loop
Pingback: How to use frequency analysis to crack the Cryptoquote puzzle - The DO Loop
Bigrams with h would be TH , CH , SH , and WH to name a few. PH and GH as well. (though, chop, should, where, phrase, ghost) who, this, that, phermones, wheel, when, show, shy, chat, chatter, chow, shut, shoulder, she, they, children, shake, change, whether, shower, why, .... H is the second letter
What word uses DL bigram ???
waddle, wheedle, idle, ...
I was not expecting a reply. Thank you kind Sir. =D
Two consecutive letters in a word is not the most useful definition of a bigram in English text. More useful is two consecutive letters in a stream of English text -- paragraphs and all that -- either with or without spaces between the words. Bigrams with spaces are useful to train deep learning artificial neural networks to recognize or produce English text. Bigrams without spaces are useful for the business of cracking ciphers with cryptanalysis, or the pastime of solving cryptograms. For example, if you treat FB is an impossible bigram in solving a cryptogram, then it would be impossible to recover the plaintext ATHIEFBORROWEDMYCAR, as it contains FB. Also, in a world of English-language news and analysis that has been saturated with IRAQIS and AL-QAEDA / AL-QAIDA for decades now, there are certainly other letters that follow Q, even within a word.