Happy holidays to all my readers! My greeting-card to you is an image of a self-similar Christmas tree. The image (click to enlarge) was created in SAS by using two features that I blog about regularly: matrix computations and ODS statistical graphics.
Self-similarity in Kronecker products
I have previously shown that the repeated Kronecker product of a binary matrix leads to self-similar structures.
Specifically, if M is a binary matrix then the Kronecker product M@M is a block matrix in which each 1 in the original matrix is replaced with a copy of M and each 0 is replaced by a zero block. (Here '@' is the Kronecker product (or direct product) operator, which is implemented in SAS/IML software.) If you repeat this process three or more times and create a heat map of the product matrix, the self-similar structure is apparent.
For example, the following 5 x 7 binary matrix has a 1 in positions that approximate the shape of a Christmas tree. The direct product M@M@M is a matrix that has 53 = 125 rows and 73 = 343 columns. If you use the HEATMAPDISC subroutine in SAS/IML to create a heat map of the direct product, you obtain the following image in which a green cell represents a 1:
proc iml;
M = {0 0 0 1 0 0 0,
     0 0 1 1 1 0 0,
     0 1 1 1 1 1 0,
     1 1 1 1 1 1 1,
     0 0 0 1 0 0 0};
Tree = M @ M @ M;     /* M is 5 x 7, so Tree is 125 x 343 */

ods graphics / width=300px height=450px  ANTIALIASMAX=50000;
call heatmapdisc(Tree) title="Happy Holidays to All my Readers!"
colorramp={White Green} displayoutlines=0 ShowLegend=0; |
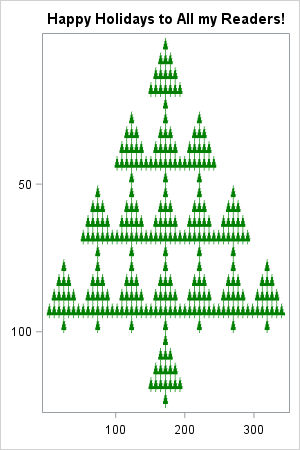
That's not a bad result for three SAS/IML statements! You can see that the "tree" has a self-similar structure: the large tree is composed of 17 smaller trees, each of which is composed of 17 mini trees.
Adding a star
My readers are worth extra effort, so I want to put a star on the top of the tree. One way to do this is to use a scatter plot and plot a special observation by using a star symbol. To plot the "tree" by using a scatter plot, it is necessary to "unpack" the 125 x 343 matrix into a list of (x, y) values (this is a wide-to-long conversion of the matrix). You can use the NDX2SUB function to extract the row and column of each 1 in the matrix, as follows:
/* extract (row, column) pairs for matrix elements that are '1' */
idx = loc(Tree = 1);                /* indices for the 1s */
s = ndx2sub(dimension(Tree), idx);  /* convert indices to subscripts */
create Tree from s[c={"RNames" "CNames"}];
append from s;
close;

call symputx("XPos", range(s[,2])/2); /* midrange = horiz position of star */
quit; |
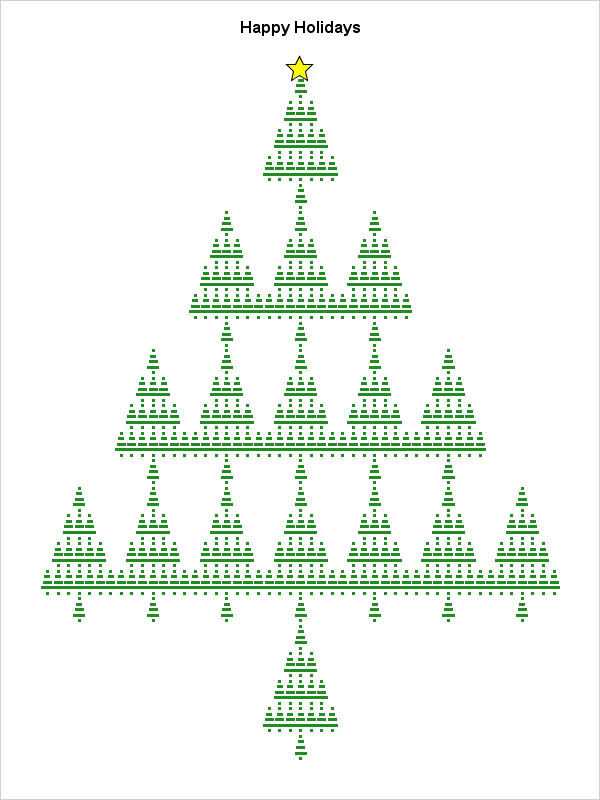
The previous statements create a SAS data set called TREE that contains the (x, y) positions of the 1s in the direct product matrix. The statements also saved the midrange value to a macro variable. The following SAS procedures create the location of the star, concatenate the two data sets, and create a scatter plot of the result, which is shown at the top of this article.
data star;
x = &XPos; y = 0;
run;

data Tree2;
set Tree star;
run;

ods graphics / width=600px height=800px  ANTIALIASMAX=50000;
title "Happy Holidays";
proc sgplot data=Tree2 noborder noautolegend;
scatter x=CNames y=RNames / markerattrs=(color=ForestGreen symbol=SquareFilled size=3);
scatter x=x y=y / markerattrs=(symbol=StarFilled size=20)             /* yellow star */
                  filledoutlinedmarkers markerfillattrs=(color=yellow);
yaxis reverse display=none;
xaxis display=none;
run; |
Previous SAS-created Christmas cards
All year long I blog about how to use SAS for serious pursuits like statistical modeling, data analysis, optimization, and simulation. Consequently, I enjoy my occasional forays into a fun and frivolous topic such as how to create a greeting card with SAS. If you like seeing geeky SAS-generated images, here is a list of my efforts from previous years:
- 2016: An animation of falling snow
- 2015: Lo, how a polar rose e'er blooming
- 2014: A Christmas tree from Pascal's triangle
- 2013: A Christmas tree matrix and heat map
- 2012: A fractal Christmas tree
- 2011: An ASCII Christmas tree
Wherever you are and whatever holiday you celebrate, may you enjoy peace and happiness this season and in the New Year.

3 Comments
My favourite tree this season... Your annual geeky SAS images are always a delight. I especially LOVE your extra effort (and coding) to create the star!
Wishing you a jolly and peaceful festive season too Rick.
Thank you, Michelle, for your constant enthusiasm and loyal readership.
a beautiful tree, a play on triangles.