Lo how a rose e'er blooming
From tender stem hath sprung
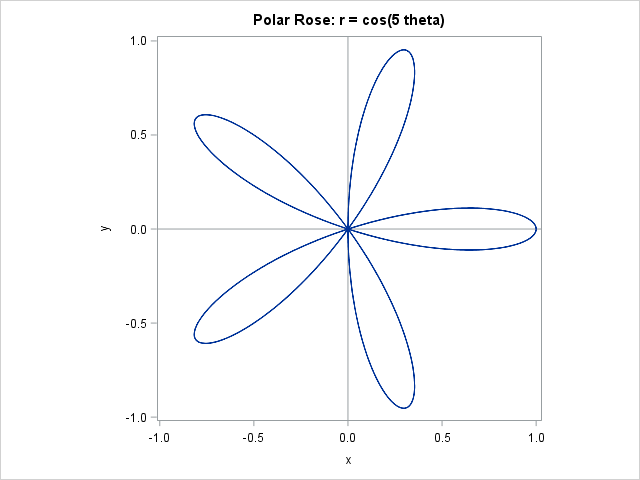
As I write this blog post, a radio station is playing Chrismas music. One of my favorite Christmas songs is the old German hymn that many of us know as "Lo, How a Rose E're Blooming." I was humming the song recently when someone asked me how to use SAS to draw curves in polar coordinates. I immediately thought about "polar roses," mathematical parametric curves of the form r = cos(k θ).
In the spirit of Christmas, I present "Lo, how a polar rose e'er blooming, from SGPLOT hath sprung."
Plotting polar coordinates in SAS
It is easy to graph a polar curve in SAS. Here's a quick overview, or a "polar express" tour, if you prefer.
Many familiar polar equations are parametric curves. The simplest are relations are of the form r = f(θ), where θ is the polar angle. The following SAS DATA step creates evenly spaced values of theta in the range [0, 2π]. For each value of theta, it computes r = cos(k θ), which is the equation for a rose with k petals. The polar coordinates (r, θ) are converted to Euclidean coordinates through the usual transformation x = r*cos(theta) and y = r*sin(theta).
After creating the points along the curve, you can visualize it by using PROC SGPLOT. The SERIES statement is used to display the parametric curve in Euclidean coordinates. The XAXIS and YAXIS statements use the MIN= and MAX= options to ensure that the image appears in a square region, and the ASPECT=1 option is used to ensure that the aspect ratio of the plot does not distort the geometry of the rose.
%let k = 5; /* draw the curve r=cos(k * theta) in polar coords, which is a k-leaved rose */ data Rose; do theta = 0 to 2*constant("pi") by 0.01; r = cos(&k * theta); /* rose */ x = r*cos(theta); /* convert to Euclidean coords */ y = r*sin(theta); output; end; run; title "Polar Rose: r = cos(&k theta)";; proc sgplot data=Rose aspect=1; refline 0 / axis=x; refline 0 / axis=y; series x=x y=y; xaxis min=-1 max=1; yaxis min=-1 max=1; run; |
Graphing generalized roses
The Wikipedia page for the polar rose contains a brief discussion about what the curve r = cos(k θ) looks like when k is a rational number n/d. When k is not an integer, most of the curves do not look like a rose—or any other kind of flower! Only a myopic mathematician would call some of these images roses.
Regardless, let's see how to get some of these "roses" to bloom in SAS. The following DATA step generates all positive rational numbers of the form n/d, where n ≤ 7 and d ≤ 9 are integers. For each value of k, the program computes the generalize rose equation and converts the values from polar to Euclidean coordinates. (Because I want to color the roses red and green for Christmas, I will also include a binary variable that will determine the color.)
data Roses; do n = 1 to 7; do d = 1 to 9; k = n / d; /* draw the rose r=cos(n/d * theta) */ group = mod(n+d, 2); /* optional: use for color */ do theta = 0 to 2*lcm(n,d)*constant("pi") by 0.1; r = cos(k * theta); /* generalized rose */ x = r*cos(theta); /* convert to Euclidean coords */ y = r*sin(theta); output; end; end; end; run; |
It is not any harder to visualize 63 roses than it is to visualize one. The SGPANEL procedures was designed to display multiple cells, each with the same type of graph. Therefore, to display an entire bouquet of roses, you merely have to specify the N and D variables on the PANELBY statement, and SAS handles the rest:
title "Polar Roses: r = cos(n/d theta)"; proc sgpanel data=Roses aspect=1 noautolegend; styleattrs datacontrastcolors=(crimson green); panelby n d / layout=lattice onepanel rowheaderpos=left; refline 0 / axis=x transparency=0.5; refline 0 / axis=y transparency=0.5; series x=x y=y / group=group; colaxis display=none; rowaxis display=none; run; |
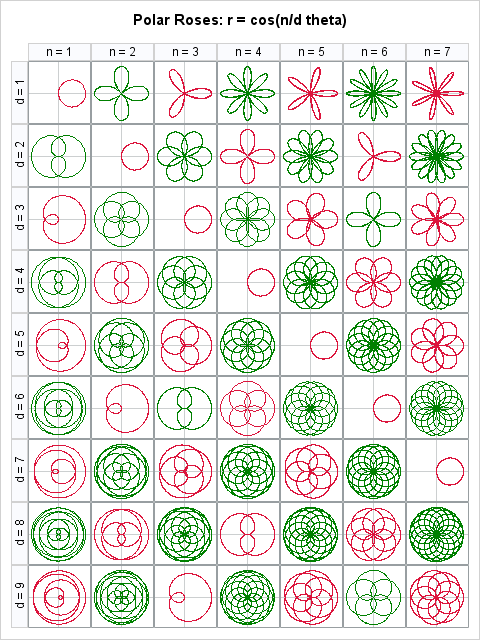
You can see certain numeric patterns in the lattice display. In particular, when n/d is a reducible fraction (such as 2/4, 3/6, and 4/8), the image is identical to the reduced fraction (such as 1/2). Do you see other patterns? Leave a comment.
These roses are beautiful, like the song that inspired me to create them. Since I get up early in the morning to write my blog, a few additional lyrics seem appropriate:
It came a blossom bright.
Amid the cold of winter
When half spent was the night.
Happy holidays to all my readers. I am taking a short vacation and will return in 2016. Until then, keep your eyes open: math, statistics, and beauty are all around you, ever blooming!

14 Comments
Happy Holidays Rick and thanks for the mathematical bouquet of roses... :-) I look forward to your posts in 2016.
Merry Christmas and a prosperous New Year to you and yours Rick, and all your readers. I enjoy your posts immensely and look forward to them in 2016.
Cheers
Thanks for making me smile! Very cool graphs. I enjoy your blog immensely. Happy Holidays to all of you at SAS -- you're all fabulous!
Reminds me of the Spirographs I used to draw as a kid!
Umm, I don´t want to spoil the fun, but the code for PROC SGPANEL doesn´t work in my environment. The LOG is below.
I´m using SAS 9.4 in a Citrix environment.
Do I need to change some settings in SAS? Or is it a Java problem?
I also wonder about the long runtime of 11 minutes for just 120k observations.
The code for just 1 rose works fine.
But I´d also like the full bouqet. :-)
99 title "Polar Roses: r = cos(n/d theta)";
100 proc sgpanel data=Roses aspect=1 noautolegend;
101 styleattrs datacontrastcolors=(crimson green);
102 panelby n d / layout=lattice onepanel rowheaderpos=left;
103 refline 0 / axis=x transparency=0.5;
104 refline 0 / axis=y transparency=0.5;
105 series x=x y=y / group=group;
106 colaxis display=none;
107 rowaxis display=none;
108 run;
NOTE: Writing HTML Body file: sashtml1.htm
NOTE: PROZEDUR SGPANEL used (Total process time):
real time 11:40.12
cpu time 1.21 seconds
NOTE: Die Antialias-Option für Marker und Linien wurde deaktiviert, da der Schwellenwert
erreicht wurde. Verwenden Sie die Option LABELMAX=122000 in der ODS GRAPHICS-Anweisung,
um die Option zu reaktivieren.
ERROR: Java Virtual Machine - Fehler. java.lang.OutOfMemoryError: Java heap space.
ERROR: Java Virtual Machine - Fehler. java.lang.OutOfMemoryError: Java heap space.
NOTE: The SAS System stopped processing this step because of errors.
NOTE: There were 121912 observations read from the data set WORK.ROSES.
I occasionally see this problem with SGPLANEL. It seems like the Java virtual machine consumes a lot of RAM, so it can fail for larger data sets, especially if other processes on your machine (SAS, operating system, e-mail, browsers,...) are also consuming memory. The easiest fix it to increase the step size that is used to generate the polar curves. In the DATA step that creates the ROSES data, change the 0.05 to 0.1, like this:
do theta = 0 to 2*lcm(n,d)*constant("pi") by 0.1;
To prevent others from encountering this problem, I have updated the blog post to use the larger step size. Thanks.
Hi Rick,
really a nice blog. Inspired by your blooming math, I took your data and now your rose is blooming and living - with an animated bubble chart in Visual Analytics
[link to internal SAS site]
Merry Christmas from Germany Thomas
Thanks, Thomas. The video was fun and included festive music. It was posted on an internal SAS site, so external readers can't see the video, but I have captured a screen shot for all to see.
The curve r=cos(k * theta) is a k-leaved rose as mentioned but only if k is odd whereas it is a 2k-leaved rose if k is even, as can be seen in the panel graph for Roses. Also, in data Rose, you can replace "2*constant("pi")" with "(2-mod(&k, 2))*constant("pi")" since if k is odd, values from 0 to pi are sufficient for theta.
I took your code and used it to make Valentine's Day Cards. See an example at http://s614.photobucket.com/user/lrkappy/media/img0_zpslkcu1ofw.png.html
Brilliant! I love it.
The code could use some cleaning up but I was excited I could make it work. I love your initial example and wanted to do it with my students for Valentine's Day to get practice with looping and then I thought I could make a bouquet.
Thanks for sharing.
you are welcome. I put a version of my code that is a bit easier to understand up on the SAS communities, https://communities.sas.com/t5/SAS-GRAPH-and-ODS-Graphics/Happy-Valentines-Day-A-Dozen-Polar-Roses/m-p/250167#U250167