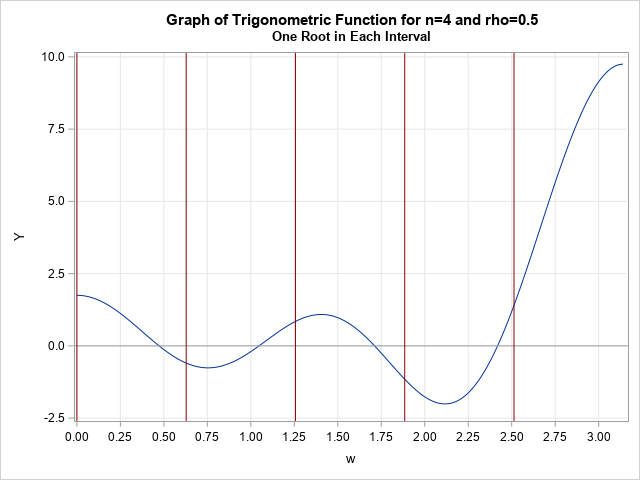
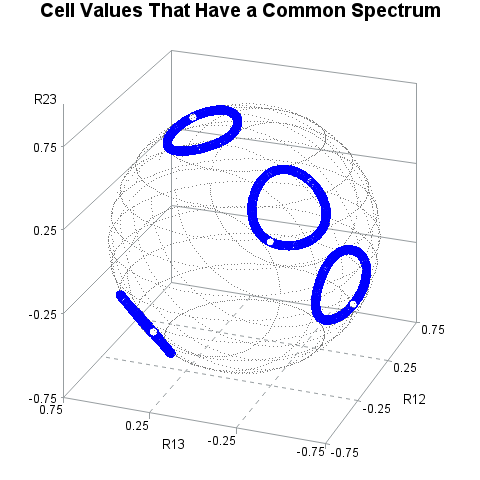
A previous article discusses how to generate a random covariance matrix with a specified set of (positive) eigenvalues. A SAS programmer asked whether it is possible to produce a correlation matrix that has a specified set of eigenvalues. After discussing the problem with a friend, I am happy to report
Tag: Matrix Computations
A colleague remarked that my recent article about using Jacobi's iterative method for solving a linear system of equations "seems like magic." Specifically, it seems like magic that you can solve a certain class of linear systems by using only matrix multiplication. For any initial guess, the iteration converges to
In a first course in numerical analysis, students often encounter a simple iterative method for solving a linear system of equations, known as Jacobi's method (or Jacobi's iterative method). Although Jacobi's method is not used much in practice, it is introduced because it is easy to explain, easy to implement,
In several previous articles, I've shown how to use SAS to fit models to data by using maximum likelihood estimation (MLE). However, I have not previously shown how to obtain standard errors for the estimates. This article combines two previous articles to show how to obtain MLE estimates and the
Many useful matrices in applied math and statistics have a banded structure. Examples include diagonal matrices, tridiagonal matrices, banded matrices, and Toeplitz matrices. An example of an unsymmetric Toeplitz matrix is shown to the right. Notice that the matrix is constant along each diagonal, including sub- and superdiagonals. Recently, I
I have previously written about how to efficiently generate points uniformly at random inside a sphere (often called a ball by mathematicians). The method uses a mathematical fact from multivariate statistics: If X is drawn from the uncorrelated multivariate normal distribution in dimensiond, then S = r*X / ||X|| has
A previous article shows how to model the probabilities in a discrete-time Markov chain by using a Markov transition matrix. A Markov chain is a discrete-time stochastic process for which the current state of the system determines the probability of the next state. In this process, the probabilities for transitioning
Given a set of N points in k-dimensional space, can you find the location that minimizes the sum of the distances to the points? The location that minimizes the distances is called the geometric median of the points. For univariate data, the "points" are merely a set of numbers $${p_1,
While writing an article about labeling a polygon by using the centroid, I almost made a false claim about the centroid. I almost claimed that that the centroid is the point in a polygon that minimizes the sum of the distances to the vertices. It is not. The point that
A colleague asked how to compute the barycentric coordinates of a point inside a triangle. Given a triangle in the plane with vertices p1, p2, and p3, every point in the triangle can be represented as a convex combination of the vertices: c1*p1 + c2*p2 + c3*p3, where c1,c2,c3 ≥
While writing an article about Toeplitz matrices, I saw an interesting fact about the eigenvalues of tridiagonal Toeplitz matrices on Nick Higham's blog. Recall that a Toeplitz matrix is a banded matrix that is constant along each diagonal. A tridiagonal Toeplitz matrix is zero except for the main diagonal, the
A Toeplitz matrix is a banded matrix. You can construct it by specifying the parameters that are constant along each diagonal, including sub- and super-diagonals. For a square N x N matrix, there is one main diagonal, N-1 sub-diagonals, and N-1 super-diagonals, for a total of 2N-1 parameters. In statistics and applied
Assigning observations into clusters can be challenging. One challenge is deciding how many clusters are in the data. Another is identifying which observations are potentially misclassified because they are on the boundary between two different clusters. Ralph Abbey's 2019 paper ("How to Evaluate Different Clustering Results") is a good way
In SAS, you can approximate the exponential of a matrix by using the EXPMATRIX function in SAS IML software. This article discusses the exponential of a matrix: what it is, how to compute it, why it is useful, and why you should think of it as a linear map that
You can use a Markov transition matrix to model the transition of an entity between a set of discrete states. A transition matrix is also called a stochastic matrix. A previous article describes how to use transition matrices for stochastic modeling. You can estimate a Markov transition matrix by using
Recently, I needed to write a program that can provide a solution to a regression-type problem, even when the data are degenerate. Mathematically, the problem is an overdetermined linear system of equations X*b = y, where X is an n x p design matrix and y is an n x 1 vector. For most
Did you know that there is a mathematical formula that simplifies finding the derivative of a determinant? You can compute the derivative of a determinant of an n x n matrix by using the sum of n other determinants. The n determinants are for matrices that are equal to the original matrix
Some matrices are so special that they have names. The identity matrix is the most famous, but many are named after a researcher who studied them such as the Hadamard, Hilbert, Sylvester, Toeplitz, and Vandermonde matrices. This article is about the Pascal matrix, which is formed by using elements from
You can use the Cholesky decomposition of a covariance matrix to simulate data from a correlated multivariate normal distribution. This method is encapsulated in the RANDNORMAL function in SAS/IML software, but you can also perform the computations manually by calling the ROOT function to get the Cholesky root and then
In a previous article, I discussed various ways to solve a least-square linear regression model. I discussed the SWEEP operator (used by many SAS regression routines), the LU-based methods (SOLVE and INV in SAS/IML), and the QR decomposition (CALL QR in SAS/IML). Each method computes the estimates for the regression
In computational statistics, there are often several ways to solve the same problem. For example, there are many ways to solve for the least-squares solution of a linear regression model. A SAS programmer recently mentioned that some open-source software uses the QR algorithm to solve least-squares regression problems and asked
Look at the following matrices. Do you notice anything that these matrices have in common? If you noticed that the rows of each matrix are arithmetic progressions, good for you. For each row, there is a constant difference (also called the "increment") between adjacent elements. For these examples: In the
A data analyst recently asked a question about restricted least square regression in SAS. Recall that a restricted regression puts linear constraints on the coefficients in the model. Examples include forcing a coefficient to be 1 or forcing two coefficients to equal each other. Each of these problems can be
Matrix balancing is an interesting problem that has a long history. Matrix balancing refers to adjusting the cells of a frequency table to match known values of the row and column sums. One of the early algorithms for matrix balancing is known as the RAS algorithm, but it is also
The Kronecker product (also called the direct product) is a binary operation that combines two matrices to form a new matrix. The Kronecker product appears in textbooks about the design of experiments and multivariate statistics. The Kronecker product seems intimidating at first, but often one of the matrices in the
If you have ever run a Kolmogorov-Smirnov test for normality, you have encountered the Kolmogorov D statistic. The Kolmogorov D statistic is used to assess whether a random sample was drawn from a specified distribution. Although it is frequently used to test for normality, the statistic is "distribution free" in
Sometimes in matrix computations, it is important to display the nonzero elements of a matrix. This can be useful for visualizing the structure of a sparse matrix (one that has many zeros) and it is also useful when describing a matrix algorithm (such as Gaussian elimination) that introduces zeros at
Rockin' around the Christmas tree At the Christmas party hop. – Brenda Lee Last Christmas, I saw a fun blog post that used optimization methods to de-noise an image of a Christmas tree. Although there are specialized algorithms that remove random noise from an image, I am not going to
Binary matrices are used for many purposes. I have previously written about how to use binary matrices to visualize missing values in a data matrix. They are also used to indicate the co-occurrence of two events. In ecology, binary matrices are used to indicate which species of an animal are
This article discusses how to restrict a multivariate function to a linear subspace. This is a useful technique in many situations, including visualizing an objective function that is constrained by linear equalities. For example, the graph to the right is from a previous article about how to evaluate quadratic polynomials.