Sometimes in matrix computations, it is important to display the nonzero elements of a matrix. This can be useful for visualizing the structure of a sparse matrix (one that has many zeros) and it is also useful when describing a matrix algorithm (such as Gaussian elimination) that introduces zeros at each step of the algorithm.
Let A be the matrix you want to visualize. You can visualize the nonzero elements of the matrix A in a graph or in a table:
- Use a custom SAS format that prints an asterisk (*) for nonzero values and a blank for zero values.
- Create a discrete heat map of the binary matrix A^=0, which replaces the nonzero cells of A with the value 1.
A text display method
For small matrices, you can use a custom SAS format to print the matrix. The format is defined by using PROC FORMAT. This format displays a star (*) for nonzero values and displays a blank for zero values:
proc format; value SparseFmt 0 = " " /* display blank instead of 0 */ other = "*"; /* display '*' instead of number */ run; proc iml; A = {1.0 0.2 0.0 0.0 0.0 0.0 1e-6, 0.2 1.0 0.2 0.0 0.0 0.0 0.0, 0.0 0.2 1.0 0.2 0.0 0.0 0.0, 0.0 0.0 0.2 1.0 0.2 0.0 0.0, 1e-6 0.0 0.0 0.2 1.0 0.2 0.0, 2e-6 1e-6 0.0 0.0 0.2 1.0 0.2, 3e-6 2e-6 1e-6 0.0 0.0 0.2 1.0 }; /* use a custom format to print * or blank in each cell */ print A[format=SparseFmt.]; |
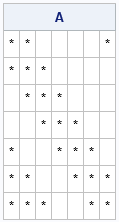
You can see the banded structure of the matrix and also see that elements near the corners are nonzero. This textual visualization is concise and is used in textbooks about numerical linear algebra.
A graphical method
For larger matrices, a graphical method is probably better. You can form the binary logical matrix B=(A^=0) and then plot B by using a two-color heat map. In the SAS/IML language, you can use the HEATMAPDISC call to create a discrete heat map of a matrix. I like to use white for the zeroes. The following SAS/IML statements define a 7 x 7 matrix and use a discrete heat map to display the nonzero values:
/* discrete heat map of binary matrix A^=0 */ ods graphics / width=400px height=400px; call heatmapdisc(A^=0) colorramp={white steelblue} title="Discrete heat map of binary matrix"; |
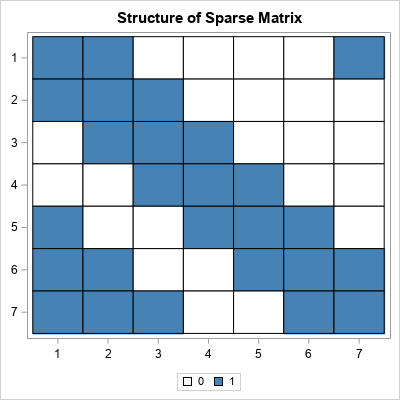
The information in the heat map is identical to the printed display. However, for large matrices, the heat map is easier to view. As shown, you can also use the ODS GRAPHICS statement to control the dimensions of the graph. So, for example, if you are visualizing a square matrix, you can make the graph square.
