Matrix balancing is an interesting problem that has a long history. Matrix balancing refers to adjusting the cells of a frequency table to match known values of the row and column sums. One of the early algorithms for matrix balancing is known as the RAS algorithm, but it is also called the raking algorithm in some fields. The presentation in this article is inspired by a paper by Carol Alderman (1992).
The problem: Only marginal totals are known
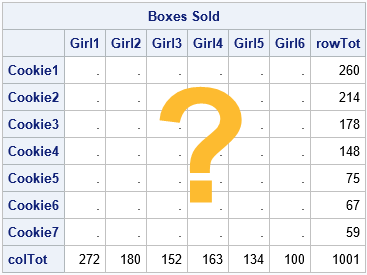
Alderman shows a typical example (p. 83), but let me give a smaller example. Suppose a troop of six Girl Scouts sells seven different types of cookies. At the end of the campaign, each girl reports how many boxes she sold. Also, the troop leader knows how many boxes of each cookie type were sold. However, no one kept track of how many boxes of each type were sold by each girl.
The situation is summarized by the following 7 x 6 table. You know the row totals, which are the numbers of boxes that were sold for each cookie type. You also know the column totals, which are the numbers of boxes that were sold by each girl. But you do not know the values of the individual cells, which are the type-by-girl totals.
Guessing the cells of a matrix
As stated, the problem usually has infinitely many solutions. For an r x c table, there are r*c cells, but the marginal totals only provide r + c linear constraints. Except for 2 x 2 tables, there are more unknowns than equations, which leads to an underdetermined linear system that (typically) has infinitely many solutions.
Fortunately, you can often obtain a unique solution if you provide an informed guess for the cells in the table. Perhaps you can ask the girls to provide estimates of the number of boxes of each type that they sold. Or perhaps you have values for the cells from the previous year. In either case, if you can estimate the cell values, you can use a matrix balancing algorithm to adjust the cells so that they match the observed marginal totals.
Let's suppose that the troop leader asks the girls to estimate (from memory) how many boxes of each type they sold. The estimates are shown in the following SAS/IML program. The row and column sums of the estimates do not match the known marginal sums, but that's okay. The program uses subscript reduction operators to compute the marginal sums of the girls' estimates. These are displayed next to the actual totals, along with the differences.
proc iml; /* Known marginal totals: */ u = {260, 214, 178, 148, 75, 67, 59}; /* total boxes sold, by type */ v = {272 180 152 163 134 100}; /* total boxes sold, by girl */ /* You don't know the cell values that produce these marginal totals, but you can ask each girl to estimate how many boxes of each type she sold */ /* G1 G2 G3 G4 G5 G6 */ A = {75 45 40 40 40 30 , /* C1 */ 40 35 45 35 30 30 , /* C2 */ 40 25 30 40 30 20 , /* C3 */ 40 25 25 20 20 20 , /* C4 */ 30 25 0 10 10 0 , /* C5 */ 20 10 10 10 10 0 , /* C6 */ 20 10 0 10 0 0 }; /* C7 */ /* notice that the row/col totals for A do not match the truth: */ rowTotEst = A[ ,+]; /* for each row, sum across all cols */ colTotEst = A[+, ]; /* for each col, sum down all rows */ Type = 'Cookie1':'Cookie7'; /* row labels */ Person = 'Girl1':'Girl6'; /* column labels */ /* print known totals, estimated totals, and difference */ rowSums = (u || rowTotEst || (u-rowTotEst)); print rowSums[r=Type c={'rowTot (u)' 'rowTotEst' 'Diff'}]; colSums = (v // colTotEst // (v-colTotEst)); print colSums[r={'colTot (v)' 'colTotEst' 'Diff'} c=Person]; |
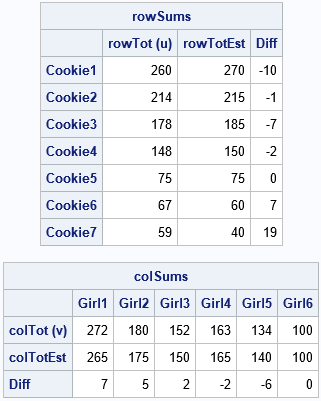
You can see that the marginal totals do not match the known row and column totals. However, you can use the guesses as an initial estimate for the RAS algorithm. The RAS algorithm will adjust the estimates to obtain a new matrix that DOES satisfy the marginal totals.
Adjusting a matrix to match marginal totals
The RAS algorithm can iteratively adjust the girls' estimates until the row sums and column sums of the matrix match the known row sums and column sums. The resulting matrix will probably not be an integer matrix. It will, however, reflect the structure of the girls' estimates in three ways:
- It will approximately preserve each girl's recollection of the relative proportions of cookie types that she sold. If a girl claims that she sold many of one type of cookie and few of another, that relationship will be reflected in the balanced matrix.
- It will approximately preserve the relative proportions of cookie types among girls. If one girl claims that she sold many more of one type of cookie than another girl, that relationship will be reflected in the balanced matrix.
- It will preserve zeros. If a girl claims that she did not sell any of one type of cookie, the balanced matrix will also contain a zero for that cell.
The RAS algorithm is explained in Alderman (1992). The matrix starts with a nonnegative r x c matrix. Let u be the observed r x 1 vector of row sums. Let v be the observed 1 x c vector of column sums. The main steps of the RAS algorithm are:
- Initialize X = A.
- Scale the rows. Let R = u / RowSum(X), where 'RowSum' is a function that returns the vector of row sums. Update X ← R # X. Here R#X indicates elementwise multiplication of each column of X by the corresponding element of R.
- Scale the columns. Let S = v / ColSum(X), where 'ColSum' is a function that returns the vector of column sums. Update X ← X # S. Here X#S indicates elementwise multiplication of each row of X by the corresponding element of S.
- Check for convergence. If RowSum(X) is close to u and ColSum(X) is close to v, then the algorithm has converged, and X is the balanced matrix. Otherwise, return to Step 2.
The RAS algorithm is implemented in the following SAS/IML program:
/* Use the RAS matrix scaling algorithm to find a matrix X that approximately satisfies X[ ,+] = u (marginals constraints on rows) X[+, ] = v (marginals constraints on cols) and X is obtained by scaling rows and columns of A */ start RAS(A, u, v); X = A; /* Step 0: Initialize X */ converged = 0; do k = 1 to 100 while(^Converged); /* Step 1: Row scaling: X = u # (X / X[ ,+]); */ R = u / X[ ,+]; X = R # X; /* Step 2: Column scaling: X = (X / X[+, ]) # v; */ S = v / X[+, ]; X = X # S; /* check for convergence: u=rowTot and v=colTot */ rowTot = X[ ,+]; /* for each row, sum across all cols */ colTot = X[+, ]; /* for each col, sum down all rows */ maxDiff = max( abs(u-rowTot), abs(v-colTot) ); Converged = (maxDiff < 1e-8); end; return( X ); finish; X = RAS(A, u, v); print X[r=Type c=Person format=7.1]; |
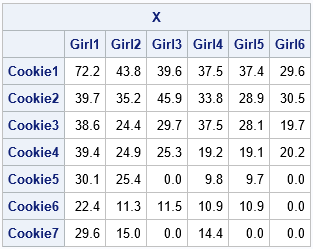
The matrix X has row and column sums that are close to the specified values. The matrix also preserves relationships among individual columns and rows, based on the girls' recollections of how many boxes they sold. The algorithm preserves zeros for the girls who claim they sold zero boxes of a certain type. It does not introduce any new zeros for cells.
You can't determine how close the X matrix is to "the truth," because you don't know the true number of boxes that each girl sold. The X matrix depends on the girls' recollections and estimates. If the recollections are close to the truth, then X will be close to the truth as well.
Summary
This article looks at the RAS algorithm, which is one way to perform matrix balancing on a table that has nonnegative cells. "Balancing" refers to adjusting the interior cells of a matrix to match observed marginal totals. The RAS algorithm starts with an estimate, A. The estimate does not need to satisfy the marginal totals, but it should reflect relationships between the rows and columns that you want to preserve, such as relative proportions and zero cells. The RAS algorithm iteratively scales the rows and columns of A to create a new matrix that matches the observed row and column sums.
It is worth mentioning the row scaling could be accumulated into a diagonal matrix, R, and the column scaling into a diagonal matrix, S. Thus, the balanced matrix is the product of these diagonal matrices and the original estimate, A. As a matrix equation, you can write X = RAS. It is this matrix factorization that gives the RAS algorithm its name.
The RAS is not the only algorithm for matrix balancing, but it is the simplest. Another algorithm, called iterative proportional fitting (IPF), will be discussed in a second article.

1 Comment
You might be interested in seeing a continuation of that field in the form of our group's tool and interface for a few scenarios of matrix balancing, including partial balancing and multidimensional matrix balancing.
We are very interested in having our system http://OUReports.com be used for real system analysis, and we will be very glad to assist any researcher in using it. Please feel free to share our project or connect us with anyone who might be interested.
In the text at https://oureports.net/OUReports/MatrixBalancing.pdf we have samples for different scenarios of matrix balancing including multidimensional balancing scenarios (p. 8-9, 19-23).
At https://oureports.net/OUReports/MatrixBalancingSamples.pdf we have more text with samples of matrix balancing for different data, including a technique we call “partial balancing” – balancing the top-left corner matrix and the low-right corner matrix and applying balancing coefficients to other parts of the original matrix (p.49). There is also a sample of how we use the dynamics of balancing coefficients by year for the analytics of art compensations in U.S. States, as well as for different types of arts (p. 34). We also have a sample for the Gross Domestic Product (GDP) by areas of the US, along with other samples.
I made some videos (given my strong accent, these are primarily for our internal team) about different scenarios of m of matrix balancing and about the general usage of our system for different data analytics and data reporting tasks. These are posted at the following YouTube channel: https://www.youtube.com/channel/UCcsTziBCeV47Njs1qN0RuQg
The data for all samples are taken from the open source data.gov for testing our system.
Irina Yaroshevskaya, PhD