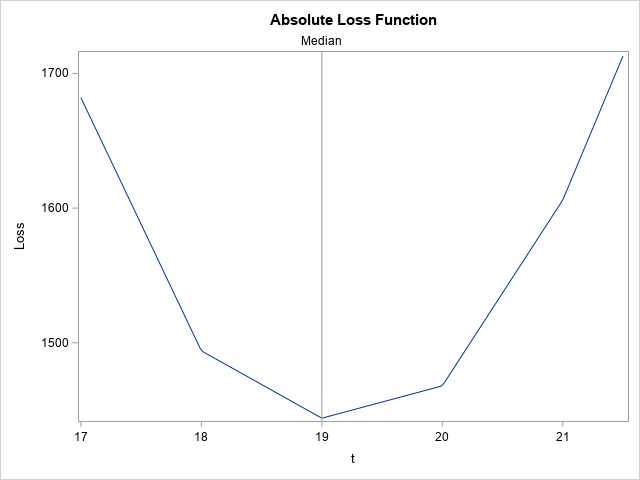
On Twitter, I saw a tweet from @DataSciFact that read, "The sum of (x_i - x)^2 over a set of data points x_i is minimized when x is the sample mean." I (@RickWicklin) immediately tweeted out a reply: "And the sum of |x_i - x| is minimized by the sample
Tag: Getting Started
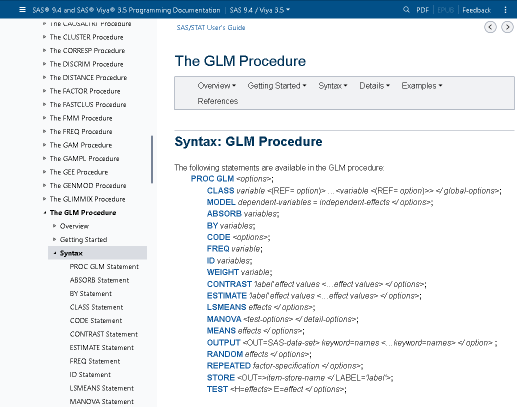
I refer to the SAS documentation every day. Usually, I want information about SAS syntax and the statistical formulas and algorithms for various options and statements. Although I have bookmarked common documentation books and chapters, sometimes it is easier to perform an internet search to find information. I've discovered a
When there are two equivalent ways to do something, I advocate choosing the one that is simpler and more efficient. Sometimes, I encounter a SAS program that simulates random numbers in a way that is neither simple nor efficient. This article demonstrates two improvements that you can make to your
The Kronecker product (also called the direct product) is a binary operation that combines two matrices to form a new matrix. The Kronecker product appears in textbooks about the design of experiments and multivariate statistics. The Kronecker product seems intimidating at first, but often one of the matrices in the
I previously wrote about the advantages of adding horizontal and vertical reference lines to a graph. You can also add a diagonal reference line to a graph. The SGPLOT procedure in SAS supports two primary ways to add a diagonal reference line: The LINEPARM statement enables you to specify a
Data tell a story. A purpose of data visualization is to convey that story to the reader in a clear and impactful way. Sometimes you can let the data "speak for themselves" in an unadorned graphic, but sometimes it is helpful to add reference lines to a graph to emphasize
Recoding variables can be tedious, but it is often a necessary part of data analysis. Almost every SAS programmer has written a DATA step that uses IF-THEN/ELSE logic or the SELECT-WHEN statements to recode variables. Although creating a new variable is effective, it is also inefficient because you have to
A family of curves is generated by an equation that has one or more parameters. To visualize the family, you might want to display a graph that overlays four of five curves that have different parameter values, as shown to the right. The graph shows members of a family of
A SAS programmer posted an interesting question on a SAS discussion forum. The programmer wanted to iterate over hundreds of SAS data sets, read in all the character variables, and then do some analysis. However, not every data set contains character variables, and SAS complains when you ask it to
An ROC curve graphically summarizes the tradeoff between true positives and true negatives for a rule or model that predicts a binary response variable. An ROC curve is a parametric curve that is constructed by varying the cutpoint value at which estimated probabilities are considered to predict the binary event.
A frequent topic on SAS discussion forums is how to check the assumptions of an ordinary least squares linear regression model. Some posts indicate misconceptions about the assumptions of linear regression. In particular, I see incorrect statements such as the following: Help! A histogram of my variables shows that they
A SAS programmer recently asked how to interpret the "standardized regression coefficients" as computed by the STB option on the MODEL statement in PROC REG and other SAS regression procedures. The SAS documentation for the STB option states, "a standardized regression coefficient is computed by dividing a parameter estimate by
In SAS, the reserved keyword _NULL_ specifies a SAS data set that has no observations and no variables. When you specify _NULL_ as the name of an output data set, the output is not written. The _NULL_ data set is often used when you want to execute DATA step code
The SAS language provides syntax that enables you to quickly specify a list of variables. SAS statements that accept variable lists include the KEEP and DROP statements, the ARRAY statement, and the OF operator for comma-separated arguments to some functions. You can also use variable lists on the VAR statements
In a recent blog post, Chris Hemedinger used a scatter plot to show the result of 100 coin tosses. Chris arranged the 100 results in a 10 x 10 grid, where the first 10 results were shown on the first row, the second 10 were shown on the second row, and so
The sweep operator performs elementary row operations on a system of linear equations. The sweep operator enables you to build regression models by "sweeping in" or "sweeping out" particular rows of the X`X matrix. As you do so, the estimates for the regression coefficients, the error sum of squares, and
As a general rule, when SAS programmers want to manipulate data row by row, they reach for the SAS DATA step. When the computation requires column statistics, the SQL procedure is also useful. When both row and column operations are required, the SAS/IML language is a powerful addition to a
My article about the difference between CLASS variables and BY variables in SAS focused on SAS analytical procedures. However, the BY statement is also useful in the SAS DATA step where it is used to merge data sets and to analyze data at the group level. When you use the
When I first learned to program in SAS, I remember being confused about the difference between CLASS statements and BY statements. A novice SAS programmer recently asked when to use one instead of the other, so this article explains the difference between the CLASS statement and BY variables in SAS
When someone refers to the correlation between two variables, they are probably referring to the Pearson correlation, which is the standard statistic that is taught in elementary statistics courses. Elementary courses do not usually mention that there are other measures of correlation. Why would anyone want a different estimate of
I have previously discussed how to define functions that safely evaluate their arguments and return a missing value if the argument is not in the domain of the function. The canonical example is the LOG function, which is defined only for positive arguments. For example, to evaluate the LOG function
Many intervals in statistics have the form p ± δ, where p is a point estimate and δ is the radius (or half-width) of the interval. (For example, many two-sided confidence intervals have this form, where δ is proportional to the standard error.) Many years ago I wrote an article
SAS programmers who have experience with other programming languages sometimes wonder whether the SAS language supports statements that are equivalent to the "break" and "continue" statements in other languages. The answer is yes. The LEAVE statement in the SAS DATA step is equivalent to the "break" statement. It provides a
A common question on SAS discussion forums is how to repeat an analysis multiple times. Most programmers know that the most efficient way to analyze one model across many subsets of the data (perhaps each country or each state) is to sort the data and use a BY statement to
In the beginning, SAS created procedures and output. The output was formless and void. Then SAS said, "Let there be ODS," and there was ODS. Customers saw that ODS was good, and SAS separated the computation from the display and management of output. The preceding paragraph oversimplifies the SAS Output
In some applications, you need to optimize a linear objective function of many variables, subject to linear constraints. Solving this problem is called linear programming or linear optimization. This article shows two ways to solve linear programming problems in SAS: You can use the OPTMODEL procedure in SAS/OR software or
SAS formats are flexible, dynamic, and have many uses. For example, you can use formats to count missing values and to change the order of a categorical variable in a table or plot. Did you know that you can also use SAS formats to recode a variable or to bin
Last week I read an interesting paper by Bob Rodriguez: "Statistical Model Building for Large, Complex Data: Five New Directions in SAS/STAT Software." In it, Rodriguez summarizes five modern techniques for building predictive models and highlights recent SAS/STAT procedures that implement those techniques. The paper discusses the following high-performance (HP)
I'm addicted to you. You're a hard habit to break. Such a hard habit to break. — Chicago, "Hard Habit To Break" Habits are hard to break. For more than 20 years I've been putting semicolons at the end of programming statements in SAS, C/C++, and Java/Javascript. But lately I've been
Two of my favorite string-manipulation functions in the SAS DATA step are the COUNTW function and the SCAN function. The COUNTW function counts the number of words in a long string of text. Here "word" means a substring that is delimited by special characters, such as a space character, a