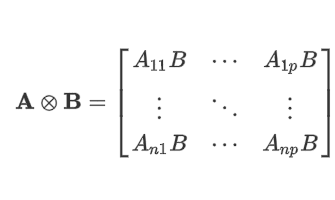
SAS formats are flexible, dynamic, and have many uses. For example, you can use formats to count missing values and to change the order of a categorical variable in a table or plot. Did you know that you can also use SAS formats to recode a variable or to bin
Tag: Getting Started
Last week I read an interesting paper by Bob Rodriguez: "Statistical Model Building for Large, Complex Data: Five New Directions in SAS/STAT Software." In it, Rodriguez summarizes five modern techniques for building predictive models and highlights recent SAS/STAT procedures that implement those techniques. The paper discusses the following high-performance (HP)
I'm addicted to you. You're a hard habit to break. Such a hard habit to break. — Chicago, "Hard Habit To Break" Habits are hard to break. For more than 20 years I've been putting semicolons at the end of programming statements in SAS, C/C++, and Java/Javascript. But lately I've been
Two of my favorite string-manipulation functions in the SAS DATA step are the COUNTW function and the SCAN function. The COUNTW function counts the number of words in a long string of text. Here "word" means a substring that is delimited by special characters, such as a space character, a
Every beginning SAS programmer learns the simple IF-THEN/ELSE statement for conditional processing in the SAS DATA step. The basic If-THEN statement handles two cases: if a condition is true, the program does one thing, otherwise the program does something else. Of course, you can handle more cases by using multiple
A grid is a set of evenly spaced points. You can use SAS to create a grid of points on an interval, in a rectangular region in the plane, or even in higher-dimensional regions like the parallelepiped shown at the left, which is generated by three vectors. You can use
SAS software can fit many different kinds of regression models. In fact a common question on the SAS Support Communities is "how do I fit a <name> regression model in SAS?" And within that category, the most frequent questions involve how to fit various logistic regression models in SAS. There
In a previous post I showed how to download, install, and use packages in SAS/IML 14.1. SAS/IML packages incorporate source files, documentation, data sets, and sample programs into a ZIP file. The PACKAGE statement enables you to install, uninstall, and manage packages. You can load functions and data into your
Descriptive univariate statistics are the foundation of data analysis. Before you create a statistical model for new data, you should examine descriptive univariate statistics such as the mean, standard deviation, quantiles, and the number of nonmissing observations. In SAS, there is an easy way to create a data set that
A dummy variable (also known as indicator variable) is a numeric variable that indicates the presence or absence of some level of a categorical variable. The word "dummy" does not imply that these variables are not smart. Rather, dummy variables serve as a substitute or a proxy for a categorical
In the SAS/IML language, you can read data from a SAS data set into a set of vectors (each with their own name) or into a single matrix. Beginning programmers might wonder about the advantages of each approach. When should you read data into vectors? When should you read data
Novice SAS programmers quickly learn the advantages of using PROC SORT to sort data, followed by a BY-group analysis of the sorted data. A typical example is to analyze demographic data by state or by ZIP code. A BY statement enables you to produce multiple analyses from a single procedure
A moving average (also called a rolling average) is a statistical technique that is used to smooth a time series. Moving averages are used in finance, economics, and quality control. You can overlay a moving average curve on a time series to visualize how each value compares to a rolling
Parameters in SAS procedures are specified a list of values that you manually type into the procedure syntax. For example, if you want to specify a list of percentile values in PROC UNIVARIATE, you need to type the values into the PCTLPTS= option as follows: proc univariate data=sashelp.cars noprint; var
Weighted averages are all around us. Teachers use weighted averages to assign a test more weight than a quiz. Schools use weighted averages to compute grade-point averages. Financial companies compute the return on a portfolio as a weighted average of the component assets. Financial charts show (linearly) weighted moving averages
Suppose that you are tabulating the eye colors of students in a small class (following Friendly, 1992). Depending upon the ethnic groups of these students, you might not observe any green-eyed students. How do you put a 0 into the table that summarizes the number of students who have each
You've had a long day. You've implemented a custom algorithm in the SAS/IML language. But before you go home, you want to generate some matrices and test your program. If you are like me, you prefer a short statement—one line would be best. However, you also want the flexibility to
Every school day thousands of teachers and students use the over 1,500 free resources in SAS Curriculum Pathways. Many will visit the most popular lessons, tools, and apps, such as Writing Navigator, the Algebra course, or the U.S. History document-analysis series. All are enormously helpful to students and teachers. But the 1,500 resources also
Dear Rick, I have a data set with 1,001 numerical variables. One variable is the response, the others are explanatory variable. How can I read the 1,000 explanatory variables into an IML matrix without typing every name? That's a good question. You need to be able to perform two sub-tasks:
As they go bakc to school, do you wish you had more time and resources (and patience?!) to help your children with their homework? Perhaps they’re struggling in a certain subject, need a little extra practice at home, or want additional activities to keep them busy? SAS Curriculum Pathways might be just
When using SAS to format a number as a percentage, there is a little trick that you need to remember: the width of the formatted value must include room for the decimal point, the percent sign, and the possibility of two parentheses that indicate negative values. The field width must
Base SAS contains many functions for processing strings, and you can call these functions from within a SAS/IML program. However, sometimes a SAS/IML programmer needs to process a vector of strings. No problem! You can call most Base SAS functions with a vector of parameters. I have previously written about
A SAS programmer wanted to plot the normal distribution and highlight the area under curve that corresponds to the tails of the distribution. For example, the following plot shows the lower decile shaded in blue and the upper decile shaded in red. An easy way to do this in SAS
As my colleague Margaret Crevar recently wrote, it is useful to know how long SAS programs take to run. Margaret and others have written about how to use the SAS FULLSTIMER option to monitor the performance of the SAS system. In fact, SAS distributes a macro that enables you to
When I am computing with SAS/IML matrices and vectors, I often want to label the columns or rows so that I can better understand the data. The labels are called headers, and the COLNAME= and ROWNAME= options in the SAS/IML PRINT statement enable you to add headers for columns and
One of the fundamental principles of computer programming is to break a task into smaller subtasks and to modularize the program by encapsulating each subtask into its own function. I have written many blog posts over the years about how to define and use functions in the SAS/IML language. I
A SAS programmer asked for a list of SAS/IML functions that operate on the columns of an n x p matrix and return a 1 x p row vector of results. The functions that behave this way tend to compute univariate descriptive statistics such as the mean, median, standard deviation, and quantiles. The following
Students on a traditional calendar usually finish the school year on a high note, brimming with knowledge, skills, and confidence. Summer is certainly a time to recharge, doing things with family and friends. Childhood and adolescence are supposed to be fun, and that is what summer vacation is for. So...
I previously wrote about the best way to suppress output from SAS procedures. Suppressing output is necessary in simulation and bootstrap analyses, and it is useful in other contexts as well. In my previous article, I wrote, "many programmers use ODS _ALL_ CLOSE as a way to suppress output, but
A common task in data analysis is to locate observations that satisfy multiple criteria. For example, you might want to locate all zip codes in certain counties within specified states. The SAS DATA step contains the powerful WHERE statement, which enables you to extract a subset of data that satisfy