I previously wrote about the advantages of adding horizontal and vertical reference lines to a graph. You can also add a diagonal reference line to a graph. The SGPLOT procedure in SAS supports two primary ways to add a diagonal reference line:
- The LINEPARM statement enables you to specify a point on the line and the slope of the line. The line extends the whole length of the graph.
- The VECTOR statement enables you to add a line segment or an arrow. You specify the initial and final points for the line segment.
This article shows how to use the LINEPARM and VECTOR statements in PROC SGPLOT. I'll call these lines "diagonal lines," but the LINEPARM and VECTOR statement can also create horizontal lines (slope=0) or vertical lines (a missing value for the slope).
A basic reference line
The LINEPARM statement in PROC SGPLOT is easy to use. For a single line, you use the X= and Y= keywords to specify a point that the line passes through. You use the SLOPE= option to specify the slope of the line.
The most common diagonal reference line is the identity line y = x. This is useful for comparing data before and after an intervention. For example, the following SAS DATA step specifies the weights for 15 women in an eight-week weight loss program. You can plot each woman's weight before and after the program. It is useful to add the identity line so that you can see at a glance whether each woman lost weight or not. The weights of women who lost weight appear below the identity line. Women who did not lose weight appear on or above the line, as shown in the following:
data Weight; input Before After @@; label Before="Baseline Weight (kg)" After="Final Weight (kg)"; datalines; 68 63 82 77 100 98 71 72 79 75 109 100 93 89 88 84 78 74 69 69 96 98 91 89 86 81 80 75 68 65 run; title "lineparm x=0 y=0 slope=1"; proc sgplot data=Weight noautolegend; scatter x=Before y=After; lineparm x=0 y=0 slope=1; /* identity line passes through (0, 0) and has slope=1 */ xaxis grid; yaxis grid; run; |
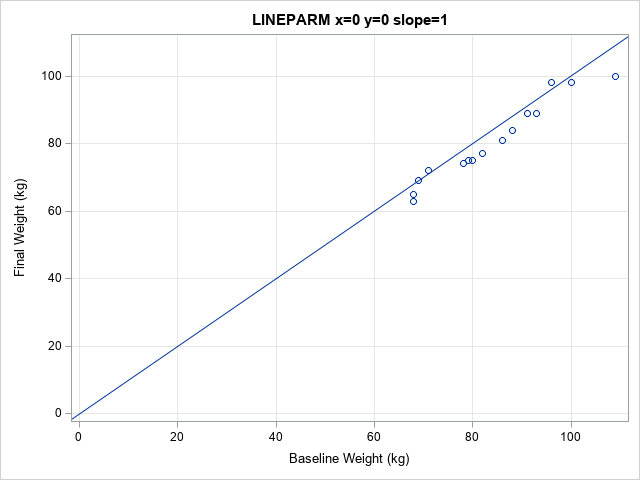
In this graph, most markers are below the line, which indicates that most women lost weight. Notice, however, that most of the markers are squashed into the upper right portion of the graph. The graph shows origin (0, 0) because I used X=0 Y=0 to specify a point on the line. You can eliminate the wasted space by specifying the CLIP option on the LINEPARM statement. The CLIP option tells PROC SGPLOT to ignore the LINEPARM statement when setting the range for the axes. This is shown in the following call:
title "The CLIP Option for the LINEPARM Statement"; proc sgplot data=Weight noautolegend; scatter x=Before y=After; lineparm x=0 y=0 slope=1 / CLIP; /* identity line passes through (0, 0) and has slope=1 */ xaxis grid; yaxis grid; /* use MAX=110 if you want to see the line when x=110 */ run; |
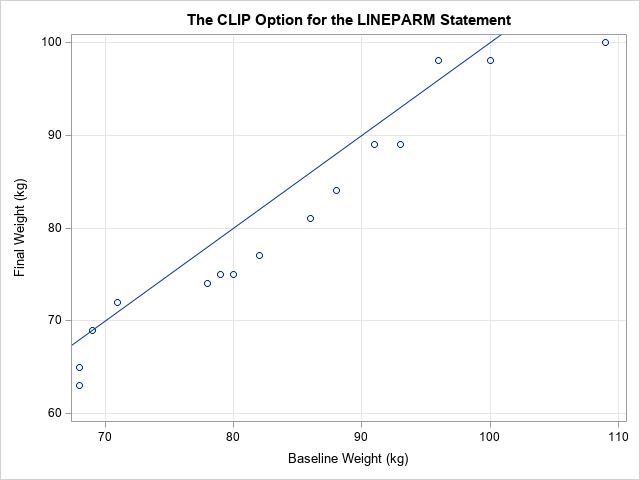
This graph is preferable in most situations. The range of the axes are based only on the data (not the line), so you can see the data more clearly.
Multiple diagonal lines
If you want to display multiple diagonal lines, you can use multiple LINEPARM statements, or you can use one LINEPARM statement and specify a variable in the data set that contains values for the points and slopes of each line.
For example, suppose you want to display tangent lines to the curve y=f(x) at several locations along the curve. As you learned in calculus, the equation of the tangent line at (x0, y0) is y = y0 + m(x-x0), where m = f`(x0) is the slope of the curve at x0. the following program generate points on the graph of y = exp(x/2) and computes the slope of the curve for x0 = 0, 1, 2, and 3.
/* First data set: points along a curve */ data Func; do x = 0 to 4 by 0.01; y = exp(x/2); output; end; run; /* Second data set: points and slopes for the tangent lines at four locations */ data Lines; do x0 = 0 to 3; y0 = exp(x0/2); /* y0 = f(x0) */ Slope = (1/2)*y0; /* m - f`(x0) */ ID + 1; output; end; run; data F1; set Func Lines; /* concatenate the data sets */ run; title "Exponential Function and Tangent Lines"; proc sgplot data=F1 noautolegend; series x=x y=y / lineattrs=(thickness=2) curvelabel="y = exp(x/2)"; /* curve */ lineparm x=x0 y=y0 slope=Slope / clip group=ID; /* tangent lines */ scatter x=x0 y=y0 / group=ID markerattrs=(symbol=CircleFilled size=8); /* points of tangency */ run; |
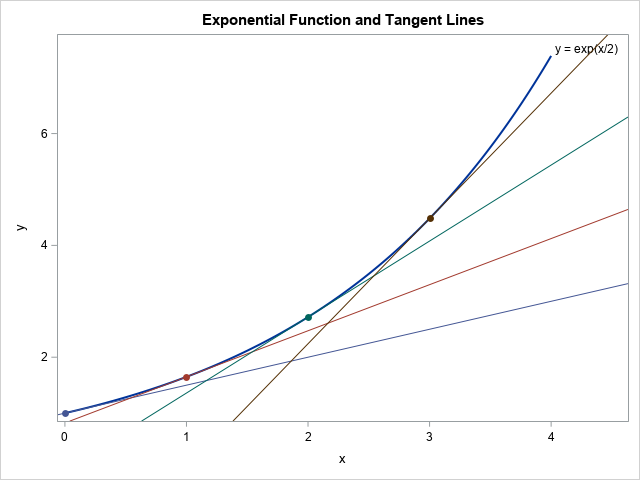
The graph shows four tangent lines. The points and slopes that determine the tangent lines are in the Lines data set. Those parameters are concatenated with the data for the curve so that the curve and the tangent lines can be drawn on a single graph. The LINEPARM statement reads the X0, Y0, and Slope variables and uses the values to draw the lines.
Vectors and line segments
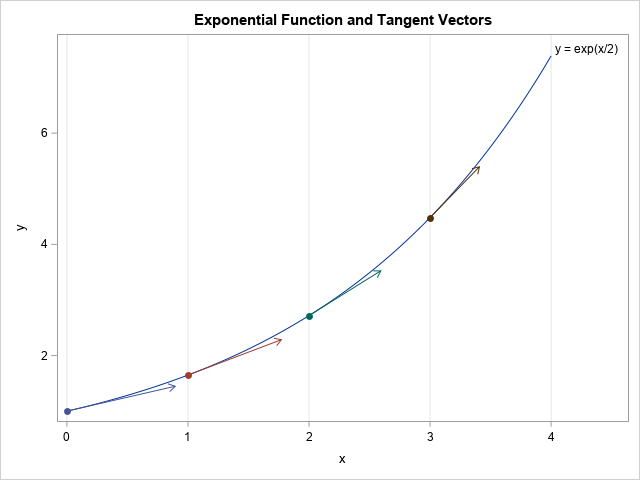
As you can see from the graphs in the previous section, the LINEPARM statement draws a line that spans the full length of the graph. Sometimes you might want to display a line segment instead. The VECTOR statement in PROC SGPLOT enables you to draw a line segment that starts at an initial point, (x0, y0), and ends at a final point, (xf, yf). By default, the VECTOR statement draws an arrow at the end point.
You can use the VECTOR statement to draw unit tangent vectors to the curve. If you take a unit step in the horizontal direction, then the tangent vector is (1, f`(x0)), so you can divide by the vector norm (which is sqrt(1 + (f`(x0))2)) to obtain a unit tangent vector.
data Vectors; do x0 = 0 to 3; y0 = exp(x0/2); slope = (1/2)*y0; dx = 1 / sqrt(1 + slope**2); /* choose dx to create a unit tangent vector */ xf = x0 + dx; yf = y0 + slope*dx; ID + 1; output; end; run; data F2; set Func Vectors; run; title "Exponential Function and Tangent Vectors"; proc sgplot data=F2 noautolegend; series x=x y=y / curvelabel="y = exp(x/2)"; vector x=xf y=yf / xorigin=x0 yorigin=y0 group=ID; scatter x=x0 y=y0 / group=ID markerattrs=(symbol=CircleFilled size=8); xaxis grid; run; |
Summary
In summary, you can use the LINEPARM statement in PROC SGPLOT to add diagonal lines to a graph. The lines span the graph from border to border. If you want to plot a line segment or an arrow, you can use the VECTOR statement.

1 Comment
Thank you Dr. Wicklin for your post (this one and all of the others). I would like to use your example here to give students in my introductory statistics class a visualization of slopes to help them understand the concept of probability density. My stats course is a general education course but students in the class are almost all majors in psychology and sociology who will need a somewhat developed understanding of probability density before going on to their advanced stats courses. I think the example you provide here is an excellent introduction for my students. If you have any additional examples or thoughts about how to teach probability density to non-math majors, I would love to hear from you.