In a recent blog post, Chris Hemedinger used a scatter plot to show the result of 100 coin tosses. Chris arranged the 100 results in a 10 x 10 grid, where the first 10 results were shown on the first row, the second 10 were shown on the second row, and so on. Placing items along each row before going to the next row is called row-major order.
An implicit formula for arranging items in rows
If you process items sequentially, it is easy to position the items in a grid by using an inductive scheme:
- Place the first item at (1, 1).
- Assume the n_th is placed at position (r, c). Place the (n+1)st item at position (r, c+1) if there is room on the current row, otherwise place it at (r+1, 1), which is the first element of the next row.
The inductive scheme is also called an implicit or recursive formula because the position of the (n+1)st item is given in terms of the position of the nth item.
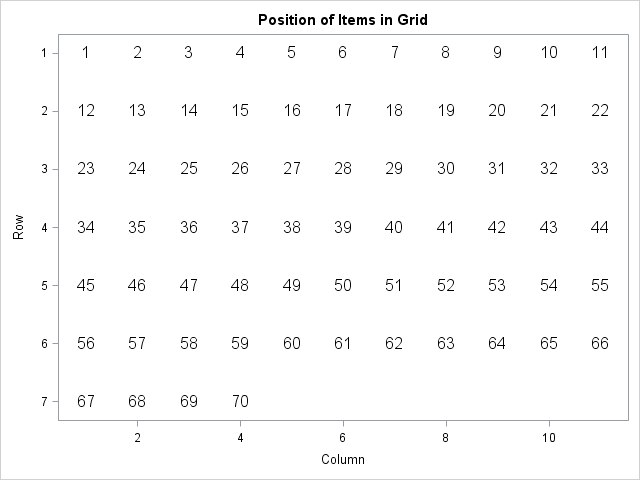
For example, suppose that you have 70 items and you want to place 11 items in each row. The inductive algorithm looks like the following:
%let Nx = 11; /* number of items in row */ data Loc; label r = "Row" c = "Column"; retain r 1 c 1 item 1; output; /* base case */ do item = 2 to 70; /* inductive step */ c + 1; if c > &Nx then do; r + 1; c = 1; end; output; end; run; title "Position of Items in Grid"; proc sgplot data=Loc; text x=c y=r text=item / textattrs=(size=12) position=center strip; xaxis integer offsetmin=0.05 offsetmax=0.05; yaxis reverse offsetmin=0.05 offsetmax=0.05; run; |
The inductive algorithm is easy to implement and to understand. However, it does not enable you to easily determine the row and column of the 1,234,567_th item if there are 11 items in each row. Nor does it enable you to compute the positions when the index increments by a value greater than 1. To answer these questions, you need to use an explicit or direct formula.
An explicit formula for arranging items in rows
The explicit formula uses the MOD function to compute the column position and integer division to compute the row position. SAS does not have an explicit "integer division operator," but you can emulate it by using the FLOOR function. The following macro definitions encapsulate the formulas:
/* (row, col) for item n if there are Nx items in each row (count from 1), assuming row-major order */ %macro ColPos(n, Nx); (1 + mod(&n.-1, &Nx.)) %mend; %macro RowPos(n, Nx); (1 + floor((&n.-1) / &Nx.)) %mend; |
The formulas might look strange because they subtract 1, do a calculation, and then add 1. This formula assumes that you want to count the items, rows, and columns beginning with 1. If you prefer to count from 0 then the formulas become MOD(n, Nx) and FLOOR(N/Nx).
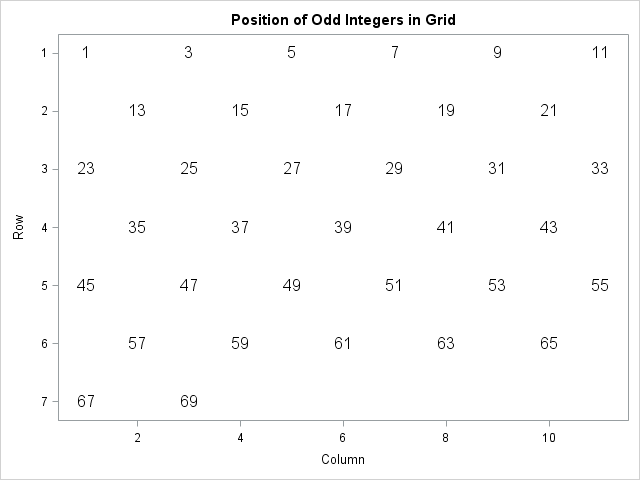
You can use the formulas to directly compute the position of the odd integers in the digits 1–70 when there are 11 items on each row:
%let Nx = 11; data grid; do item = 1 to 70 by 2; /* only odd integers */ row = %RowPos(item, &Nx); col = %ColPos(item, &Nx); output; end; run; title "Position of Odd Integers in Grid"; proc sgplot data=grid; text x=col y=row text=item / textattrs=(size=12) position=center strip; xaxis integer offsetmin=0.05 offsetmax=0.05 label="Column" max=&Nx; yaxis reverse offsetmin=0.05 offsetmax=0.05 integer label="Row"; run; |
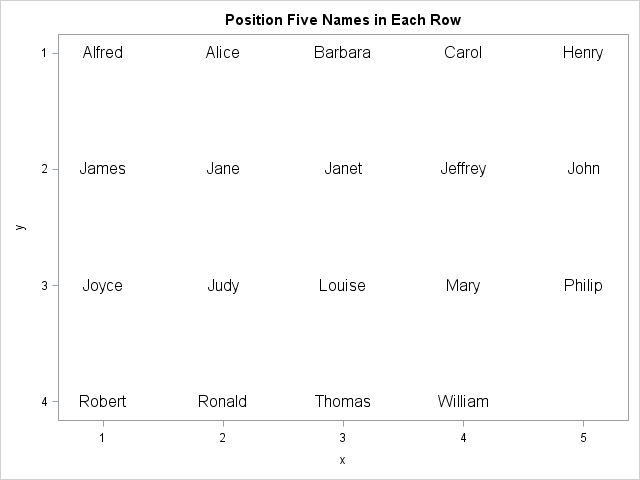
Of course, you can also use the direct formula to process items incrementally. The following DATA step computes the positions for 19 observations in the Sashelp.Class data set, where five names are placed in each row:
data gridName; set sashelp.class; y = %RowPos(_N_, 5); /* 5 columns in each row */ x = %ColPos(_N_, 5); run; title "Position Five Names in Each Row"; proc sgplot data=gridName; text x=x y=y text=Name / textattrs=(size=12) position=center strip; xaxis integer offsetmin=0.08 offsetmax=0.08; yaxis reverse offsetmin=0.05 offsetmax=0.05 integer; run; |
The explicit formula is used in the SAS/IML NDX2SUB function, which tells you the row and column information for the n_th item in a matrix.
In summary, you can use an implicit formula or an explicit formula to arrange items in rows, where each row contains Nx items. The implicit formula is useful when you are arranging the items sequentially. The explicit formula is ideal when you are randomly accessing the items and you need a direct computation that provides the row and column position.
Finally, if you want to arrange items in column-major order (down the first column, then down the second,...), you can use similar formulas. The row position of the n_th item is 1 + mod(n-1, Ny) and the column position is 1 + floor((n-1) / Ny), where Ny is the number of rows in the grid.

1 Comment
Wish I had this tip 3 weeks ago! Do you know how long it took me to line up those items in a grid? Embarrassing how much time I spent on that. I had to add two "Rando" characters to my data to make it a 10x10 matrix, just to simplify things. IMDB listed only 98 credited characters in the Avengers: Infinity War movie, and I could not figure out how to get SGPLOT to make that look neat.