An ROC curve graphically summarizes the tradeoff between true positives and true negatives for a rule or model that predicts a binary response variable. An ROC curve is a parametric curve that is constructed by varying the cutpoint value at which estimated probabilities are considered to predict the binary event. Most SAS data analysts know that you can fit a logistic model in PROC LOGISTIC and create an ROC curve for that model, but did you know that PROC LOGISTIC enables you to create and compare ROC curves for ANY vector of predicted probabilities regardless of where the predictions came from? This article shows how!
If you want to review the basic constructions of an ROC curve, you can see a previous article that constructs an empirical ROC curve from first principles. The PROC LOGISTIC documentation provides formulas used for constructing an ROC curve.
Produce an ROC plot by using PROC LOGISTIC
Before discussing how to create an ROC plot from an arbitrary vector of predicted probabilities, let's review how to create an ROC curve from a model that is fit by using PROC LOGISTIC. The following data and model are taken from the the PROC LOGISTIC documentation. The data are for 43 cancer patients who also had an intestinal obstruction. The response variable popInd is a postoperative indicator variable: popInd = 1 for patients who died within two months after surgery. The explanatory variables are three pre-operative screening tests. The goal of the study is to determine patients who might benefit from surgery, where "benefit" is measured by postoperative survival of at least two months.
data roc; input alb tp totscore popind @@; totscore = 10 - totscore; datalines; 3.0 5.8 10 0 3.2 6.3 5 1 3.9 6.8 3 1 2.8 4.8 6 0 3.2 5.8 3 1 0.9 4.0 5 0 2.5 5.7 8 0 1.6 5.6 5 1 3.8 5.7 5 1 3.7 6.7 6 1 3.2 5.4 4 1 3.8 6.6 6 1 4.1 6.6 5 1 3.6 5.7 5 1 4.3 7.0 4 1 3.6 6.7 4 0 2.3 4.4 6 1 4.2 7.6 4 0 4.0 6.6 6 0 3.5 5.8 6 1 3.8 6.8 7 1 3.0 4.7 8 0 4.5 7.4 5 1 3.7 7.4 5 1 3.1 6.6 6 1 4.1 8.2 6 1 4.3 7.0 5 1 4.3 6.5 4 1 3.2 5.1 5 1 2.6 4.7 6 1 3.3 6.8 6 0 1.7 4.0 7 0 3.7 6.1 5 1 3.3 6.3 7 1 4.2 7.7 6 1 3.5 6.2 5 1 2.9 5.7 9 0 2.1 4.8 7 1 2.8 6.2 8 0 4.0 7.0 7 1 3.3 5.7 6 1 3.7 6.9 5 1 3.6 6.6 5 1 ; ods graphics on; proc logistic data=roc plots(only)=roc; LogisticModel: model popind(event='0') = alb tp totscore; output out=LogiOut predicted=LogiPred; /* output predicted value, to be used later */ run; |
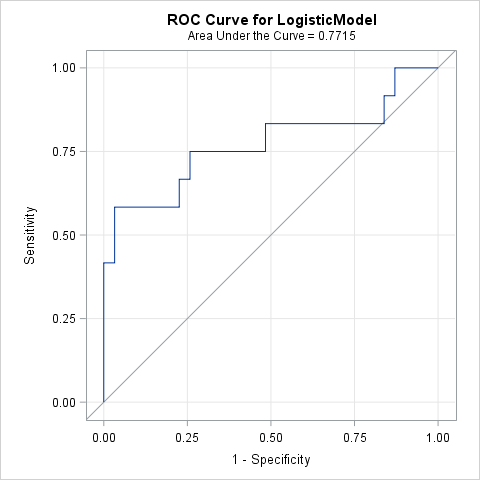
You can see the documentation for details about how to interpret the output from PROC LOGISTIC, but the example shows that you can use the PLOTS=ROC option (or the ROC statement) to create an ROC curve for a model that is fit by PROC LOGISTIC. For this model, the area under the ROC curve is 0.77. Because a random "coin flip" prediction has an expected area of 0.5, this model predicts the survival of surgery patients better than random chance.
Create an ROC curve for any prediction rule
A logistic model is not the only way to predict a binary response. You could also use a decision tree, a generalized mixed model, a nonparametric regression model, or even ask a human expert for her opinion. An ROC curve only requires two quantities: for each observation, you need the observed binary response and a predicted probability. In fact, if you carefully read the PROC LOGISTIC documentation, you will find these sentences:
- In the "Details" section: "ROC curves can be created ... from the specified model in the MODEL statement, from specified models in ROC statements, or from input variables which act as [predicted probabilities]." (Emphasis added.)
- In the documentation of the ROC statement: "The PRED= option enables you to input a criterion produced outside PROC LOGISTIC; for example, you can fit a random-intercept model by using PROC GLIMMIX or use survey weights in PROC SURVEYLOGISTIC, then use the predicted values from those models to produce an ROC curve for the comparisons."
In other words, you can use PROC LOGISTIC to create an ROC curve regardless of how the predicted probabilities are obtained! For argument's sake, let's suppose that you ask a human expert to predict the probability of each patient surviving for at least two months after surgery. (Notice that there is no statistical model here, only a probability for each patient.) The following SAS DATA step defines the predicted probabilities, which are then merged with the output from the earlier PROC LOGISTIC call:
data ExpertPred; input ExpertPred @@; datalines; 0.95 0.2 0.05 0.3 0.1 0.6 0.8 0.5 0.1 0.25 0.1 0.2 0.05 0.1 0.05 0.1 0.4 0.1 0.2 0.25 0.4 0.7 0.1 0.1 0.3 0.2 0.1 0.05 0.1 0.4 0.4 0.7 0.2 0.4 0.1 0.1 0.9 0.7 0.8 0.25 0.3 0.1 0.1 ; data Survival; merge LogiOut ExpertPred; run; /* create ROC curve from a variable that contains predicted values */ proc logistic data=Survival; model popind(event='0') = ExpertPred / nofit; roc 'Expert Predictions' pred=ExpertPred; ods select ROCcurve; run; |
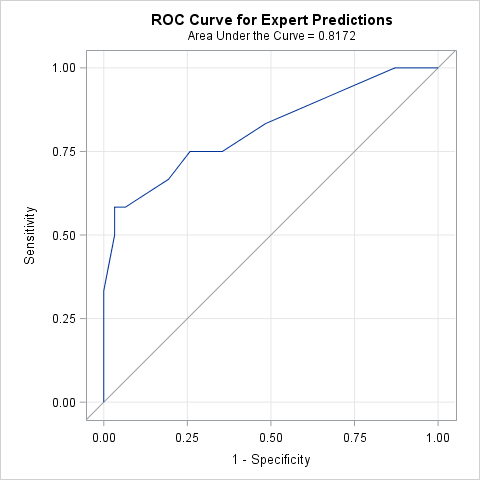
Notice that you only need to supply two variables on the MODEL statements: the observed responses and the variable that contains the predicted values. On the ROC statement, I've used the PRED= option to indicate that the ExpertPred variable is not being fitted by the procedure. Although PROC LOGISTIC creates many tables, I've used the ODS SELECT statement to suppress all output except for the ROC curve.
Overlay and compare ROC curves from different models or rules
You might want to overlay and compare ROC curves from multiple predictive models (either from PROC LOGISTIC or from other sources). PROC LOGISTIC can do that as well. You just need to merge the various predicted probabilities into a single SAS data set and then specify multiple ROC statements, as follows:
/* overlay two or more ROC curves by using variables of predicted values */ proc logistic data=Survival; model popind(event='0') = LogiPred ExpertPred / nofit; roc 'Logistic' pred=LogiPred; roc 'Expert' pred=ExpertPred; ods select ROCOverlay; /* optional: for a statistical comparison, use ROCCONTRAST stmt and remove the ODS SELECT stmt */ *roccontrast reference('Expert Model') / estimate e; run; |
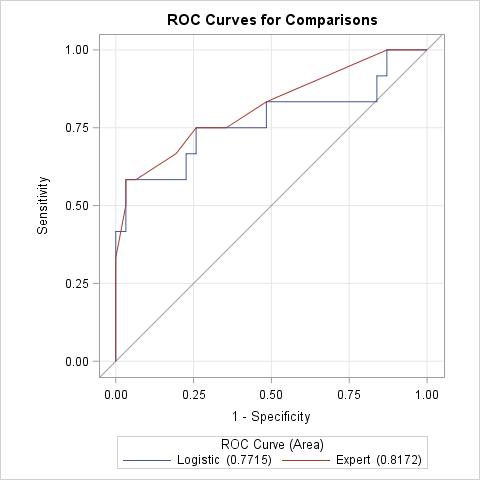
This ROC overlay shows that the "expert" prediction is almost always superior or equivalent to the logistic model in terms of true and false classification rates. As noted in the comments of the previous call to PROC LOGISTIC, you can use the ROCCONTRAST statement to obtain a statistical analysis of the difference between the areas under the curves (AUC).
In summary, you can use the ROC statement in PROC LOGISTIC to generate ROC curves for models that were computed outside of PROC LOGISTIC. All you need are the predicted probabilities and observed response for each observation. You can also overlay and compare two or more ROC curves and use the ROCCONTRAST statement to analyze the difference between areas under the curves.

13 Comments
Thanks for this post Dr. Wicklin!
Your posts on ROCs and calibration plots are insightful, clearly explained, and very useful!
I was wondering if you had any commentary on how contrasting the AUC from ROC curves compares with something like net reclassification index and decision curves for adding new variables to prediction models?
I don't have any original thoughts on this topic. Steyerberg et al. (2010) wrote a nice summary and proposed situations in which practitioners might prefer one assessment method over another.
Pingback: Discrimination, accuracy, and stability in binary classifiers - The DO Loop
this is very good - a nice follow up would be looking at logistic/ROCs for training and test sets using outmodel/inmodel or proc plm
Hi Rick, similar to using PROC LOGISTIC to compare any predictive model, is there a way to compare the R^2 as well?
Dear Rick, Your post is very helpful. Thanks a lot. Is there a way ROC can be done for multinomial logistic regression models?
I think so, although I haven't done it myself. See the SAS Sample, "Area under the ROC curve measure (AUC) for multinomial models." Let me know if you are successful.
Hi,
I am getting the following warnings when I try to recreate the ROC curve using expert predictions:
proc logistic data=Survival;
model popind(event='0') = ExpertPred / nofit;
roc 'Expert Predictions' pred=ExpertPred;
ods select ROCcurve;
run;
NOTE: The ROC statement is ignored unless you have at least 2 valid models.
NOTE: PROC LOGISTIC is modeling the probability that popind=0.
WARNING: Output 'ROCcurve' was not created. Make sure that the output object name, label, or path is spelled correctly. Also,
verify that the appropriate procedure options are used to produce the requested output object. For example, verify that
the NOPRINT option is not used.
You can ask SAS questions at the SAS Support Communities. That warning occurs when the graph or table ('ROCcurve') is not produced. Since the syntax appears to be copied from this article, the only idea I have is that you are running an old version of SAS. THe NOFIT option was introduced in SAS 9.4M3.
Vipul,
I had the same "Output ROCcurve not created" warning on SAS 9.4M6 for Windows. I removed the NOFIT, and then it worked. I removed ODS SELECT to verify the model was fine, and it was fine. On other models, I use NOFIT, and it works. Hmm.
Hi Rick, May I ask you a question? We have two groups of patients.The values of variable X are higher on average for the treated group than for the control. We would like the rule for classification be in the form of comparison of variable X with a threshold. How to sign the probabilities of belonging to the class of treated in this case?
for calculating ROC/AUC is SAS following your approach?
Many thanks!
You can ask SAS questions, post data, and share programs at the SAS Support Communities.
HOw to pick a cutoff for a covariate that maximize Area under the curve for a ROC