As a general rule, when SAS programmers want to manipulate data row by row, they reach for the SAS DATA step. When the computation requires column statistics, the SQL procedure is also useful. When both row and column operations are required, the SAS/IML language is a powerful addition to a SAS programmer's toolbox.
I was reminded of this fact recently when a SAS programmer (possibly a student) asked how to "manually" perform the classic chi-square test for association in a two-way frequency table. The computation requires computing the means across rows and down columns, and the student was struggling with implementing the computations in the DATA step. This article illustrates how SAS/IML can simplify the rowwise and columnwise computations in the classic chi-square test.
The chi-square test for association in PROC FREQ
In SAS, the easy way to compute the chi-square test for association is to use PROC FREQ. The following data are from several examples in the PROC FREQ documentation. The data shows the hair color and eye color of 762 European children. The call to PROC FREQ computes the chi-square test and a cross-tabulation that displays the observed value, expected values (under the hypothesis that hair color and eye color are independent), and deviations, which are the "observed minus expected" values:
data Color; input Eyes $ Hair $ Count @@; label Eyes ='Eye Color' Hair ='Hair Color'; datalines; blue black 6 blue dark 51 blue fair 69 blue medium 68 blue red 28 brown black 16 brown dark 94 brown fair 90 brown medium 94 brown red 47 green dark 37 green fair 69 green medium 55 green red 38 ; title 'Eye and Hair Color of European Children'; proc freq data=Color; tables Eyes*Hair / nopercent norow nocol deviation expected chisq; weight Count; run; |
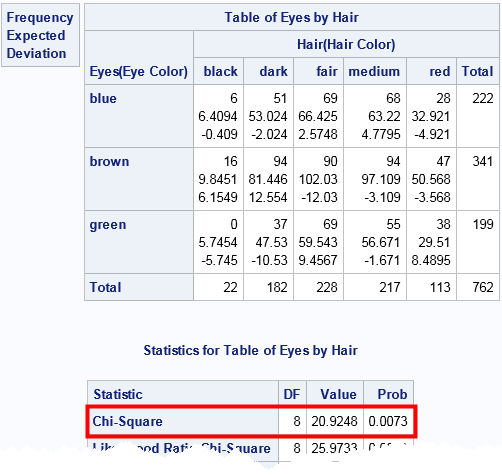
In the eye-by-hair table, each cell contains three values. The first value is the observed cell count, the second value is the expected cell count (assuming independence), and the third value is their difference, which is sometimes called the "deviation." The test statistic and p-value for the chi-square test are outlined in red. The test statistic is 20.92. The probability of observing that value from a random draw of a chi-square distribution with 8 degrees of freedom is 0.0073. Because that probability is so small, we reject the null hypothesis that hair color and eye color are independent.
Compute the chi-square test "manually" in SAS
The chi-square test on a 3 x 4 table is simple enough to compute by hand, but suppose you want to use SAS to validate or reproduce the numbers that PROC FREQ produces? This is a good programming exercise for students to make sure they understand the computations. The PROC FREQ documentation provides the formula for the test statistic by using the equation
where nij is the observed count in row i and column j and eij is the expected count, but there is nothing like programming a formula to ensure understanding.
The following steps indicate the (vectorized) computations that can be used to implement the chi-square test in SAS/IML.
- Use subscript reduction operators to compute the means for each row and column, and the grand mean for all cells.
- Use an outer product to form the table of expected values from the mean vectors.
- Compute the test statistic by using elementwise matrix operations.
- Use the CDF function to compute the p-value.
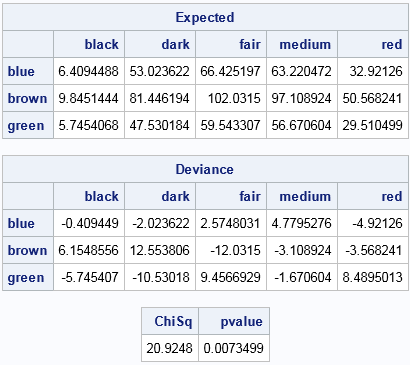
proc iml; /* row means, column means, and overall mean */ cName = {"black" "dark" "fair" "medium" "red"}; rName = {"blue" "brown" "green"}; C = { 6 51 69 68 28, 16 94 90 94 47, 0 37 69 55 38}; colMarg = C[:, ]; /* mean of each column */ rowMarg = C[ ,:]; /* mean of each row */ grandMean = rowMarg[:]; /* grand mean (also C{:]) */ /* expected values under hypothesis of independence */ Expected = rowMarg*colMarg / grandMean; /* outer product */ Deviance = C - Expected; /* difference (observed-expected) for each cell */ /* chi square statistic: Sum(( Observed[i,j] - Expected[i,j])^2 / Expected[i,j] ) */ ChiSq = sum( Deviance##2 / Expected ); DF = (nrow(C)-1) * (ncol(C)-1); pvalue = 1 - cdf("ChiSq", ChiSq, DF); print Expected[c=cName r=rName], Deviance[c=cName r=rName]; print ChiSq pvalue; quit; |
Notice that the program does not contain any loops, although the formulas contain double summations over the elements of the table. This is an example of "vectorizing" the computations, which means writing the computations as vector or matrix computations rather than scalar operations in a loop.
You can see that the 'Expected' matrix matches the PROC FREQ output for the expected values for each cell. Similarly, the 'Deviance' matrix matches the PROC FREQ output for the difference between observed and expected values. The test statistic is the sum of the ratios of the squared deviances and the expected values. A call to the CDF function computes the p-value.
In summary, you can use the high-level SAS/IML language to implement basic statistical tests such as the chi-square test for association in a two-way frequency table. Such an exercise enables students to understand the details of elementary statistical tests. For programmers who know the statistical details but who are new to the SAS/IML language, this short exercise provides a way to gain proficiency with vectorized programming techniques.

5 Comments
Rick,
I think the following code is more readable.
proc iml;
cName = {"black" "dark" "fair" "medium" "red"};
rName = {"blue" "brown" "green"};
C = { 6 51 69 68 28,
16 94 90 94 47,
0 37 69 55 38};
colMarg = C[+, ]/c[+]; /* margin probability of each column */
rowMarg = C[ ,+]/c[+]; /* margin probability of each row */
expect=(rowMarg*colMarg)#c[+];
print expect[r=rName c=cName];
quit;
Hi Rick,
Do you know if this manual method is much quicker than using 'proc freq'?
It's taking very long to compute the Chi2 p-values when running 'proc freq' separately 15,000 times (150 different subgroups x 100 variables).
Many thanks,
Charles.
I am not sure I understand your data. You should use a BY statement to run statistics on the subgroups. I'm not sure what you mean by "100 variables." Do you want tests of independence for 100 one categorical variables? I suggest you post your problem, your code, and sample data to the SAS Support Communities.
Thanks Rick.
We did try by-statement processing and it improved the speed.
By 'variables' I mean 100 categorical outcome variables that are collected on each patient in a data set, each to be tested for their associations with another set of 150 subgroup variables (age group, sex, etc).. so it would amount to 15,000 separate Chi2 tests.
Sorry I haven't been able to put the code here, but my question was more of a general one about whether it's computationally faster to calculate the Chi2 stats manually as in your example above, versus doing it with PROC FREQ.
Do you have a sense which is quicker in general, or is the only way to test it with example code?
Many thanks,
Charles.
Without seeing the SAS code, I cannot determine which method is faster. It might be possible to use matrix expressions in IML to carry out the 150 tests at once, but I'm not sure. As Sherlock Holmes famously said, "It is a capital mistake to theorize before one has data."