A previous article discusses the fact that there are often multiple ways in SAS to obtain the same result. This fact results in many vigorous discussions on online programming forums as people propose different (but equivalent) methods for solving someone's problem then argue why their preferred method is better than the others. It also has implications for reproducibility of generative AI assistants such as SAS Viya Copilot.
Here's a real-life example: A SAS programmer asked how to use SAS to display the three largest values of a target variable for each group. I will provide three solutions in this article, but feel free to post additional solutions in the comments. The methods in this article are as follows:
- PROC SORT and the DATA step: You can sort the data by the group variable and by the target variable. Then use BY-group processing and the FIRST.variable indicator variable in a DATA step to extract the relevant values.
- PROC RANK: You can ask PROC RANK to provide the largest (or smallest) values in a data set.
- PROC MEANS: You can ask PROC MEANS to provide the largest (or smallest) values in a data set.
Example data
Let's first choose some data to analyze. The Sashelp.Stocks data contains the trading volume for three stocks (IBM, Intel, and Microsoft) for the first trading day of 233 months from 01AUG1986 to 01DEC2005. Suppose you want to find the largest trading volumes for each stock and the day on which it occurred. The volumes are reported in millions of shares, so the following DATA step rescales the Volume variable. A call to PROC SGPLOT visualizes the data:
/* represent the volume in millions and keep only relevant variables */ data have; set sashelp.stocks; Volume = Volume / 1E6; label Volume= "Volume (Millions)"; format Volume; keep Date Stock Volume; run; proc sort data=have out=sort_stocks; /* prepare for plotting a SERIES */ by Stock Date; run; /* visualize the trading volume for each stock */ title "Days of Maximum Volume for Three Stocks"; proc sgplot data=sort_stocks; series x=Date y=Volume / group=Stock curvelabel; yaxis grid; xaxis grid; run; |
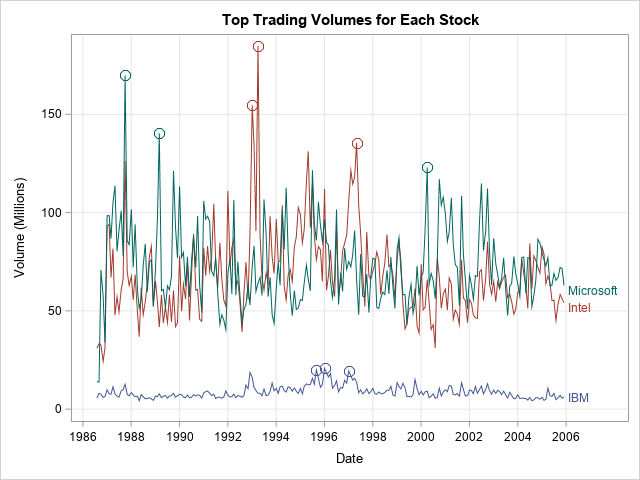
For each stock, I have added circles to highlight the three days of largest trading volume. These are the volumes and days that we want to find.
BY-group processing in the DATA step
If you know about BY-group processing and the FIRST.variable indicator variable, it is straightforward to use the DATA step to extract the top values of the Volume variable. In the following programs, I have created a SAS macro variable named 'Top', which has the value 3. You can change that value to, say, 5, if you want the top five values in each group.
To extract the top values of the Volume variable for each stock, first sort the data by the Stock variable, which is the BY-group variable. At the same time, sort the data in DESCENDING order by volume. After sorting the data in this way, you can use the FIRST.Stock indicator variable to identify the first observation in each group. Obtain the solution by outputting only the first few observations of each group, as follows:
/* how many top values to list? */ %let Top = 3; /* sort (descending) and then use first.variable indicator variables */ proc sort data=have out=sort_vol; by Stock descending Volume; run; data Top; set sort_vol; by Stock; /* for each group... */ retain Count; if first.Stock then Count = 1; /* initialize the counter */ if Count <= &Top then /* output obs that have largest values */ output; Count + 1; run; title "Result from Sort and BY-Group Processing"; proc print data=Top label noobs; run; |
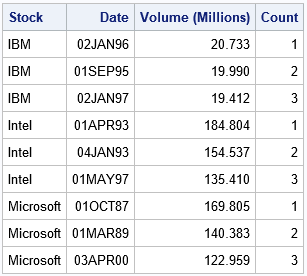
The DATA step extracts the top values as shown. This algorithm works even if a BY group has fewer than &Top observations.
PROC RANK for extracting the top values
PROC RANK is a natural way to identify the top or bottom values within groups. By default, PROC RANK assigns Rank=1 to the minimum value, but you can use the DESCENDING option to assign Rank=1 to the maximum value. By default, PROC RANK will create an output data set that has the same number of observations as the input data. However, you can use a WHERE clause to restrict the output data to contain only observations for which the rank is less than or equal to 3 (or any other value).
/* Use PROC RANK to extract the observations in each group that have maximum Volume */ proc rank data=sort_stocks out=want(where=(Rank <= &Top)) /* keep only top ranks */ descending ties=low; /* use DESCENDING option to get largest values */ by Stock; var Volume; ranks Rank; run; /* sort by the rank within each group */ proc sort data=want; by Stock Rank; run; title "Result from PROC RANK"; proc print data=want label noobs; run; |
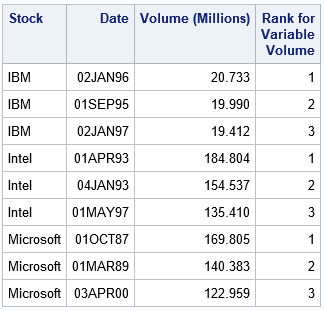
The results are shown. The largest values are assigned the smallest ranks. Only the three largest volumes are saved to the output data set.
PROC MEANS for displaying the top values
On the discussion forum, 'ballardw' pointed the SAS programmer to an example in the PROC MEANS documentation that shows how to identify extreme observations in data. You can use the CLASS statement in PROC MEANS to identify the group variable. On the OUTPUT statement, use the IDGROUP option and the MAX suboption, along with the OUT[&Top] directive, as follows:
proc means data=sort_stocks noprint; class Stock; var Volume; output out=meanTop(where=(_Type_>0)) idgroup( max(Volume) /* statistic: max or min */ out[&Top](Volume Date)=MaxVol Date /* names are MaxVol_1,...,Date_3 */ ); run; title "Result from PROC MEANS"; proc print data=meanTop noobs; var Stock MaxVol: Date:; run; |
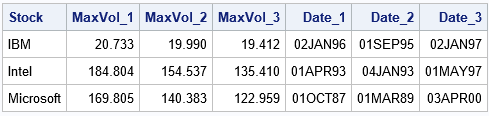
You can see that this table is in the "wide" format rather than the "long" format. That is. the data are in variables MaxVol_1-MaxVol_3 and the corresponding dates are in the variables Date_1-Date_3. You can specify the prefixes as part of the OUT suboption.
I was not previously familiar with the IDGROUP option in PROC MEANS. The syntax is somewhat arcane, but the option is useful, especially if you want the results in a wide format.
Summary
A programming task can have many correct solutions. This article shows three ways to use SAS to display the largest values of a target variable for each group. I showed the following methods:
- Sort the data, then use BY-group processing and the FIRST.variable indicator variable in a DATA step.
- PROC RANK provides the largest (or smallest) values in a data set.
- PROC MEANS provides the largest (or smallest) values in a data set.
Do you have a different way to solve this problem? Post your solution in a comment.

2 Comments
Rick,
1)The fourth way is using PROC UNIVARIATE:
ods select none;
ods output ExtremeObs=ExtremeObs ExtremeValues=ExtremeValues;
proc univariate data=sashelp.stocks nextrobs=3 nextrval=3;
class Stock;
var Volume;
run;
ods select all;
2) The fifth way is using PROC SQL, but that is too clumsy ,I don't want to show here.
Yes, the ExtremeObs table is the one I would use. And you can add
ID Date;
if you want to see the dates on which the minimum/maximum volumes occur.