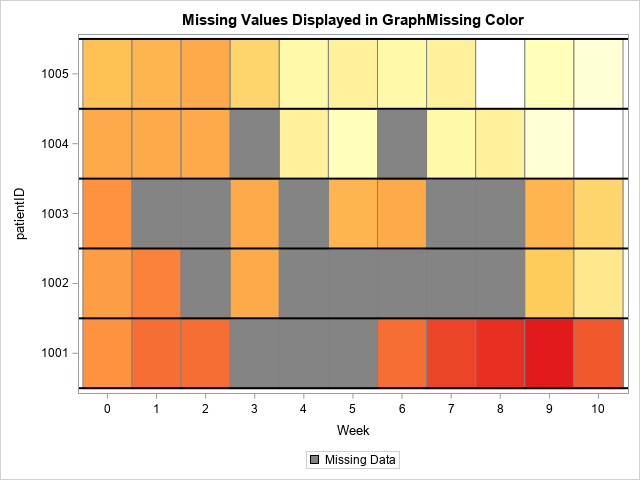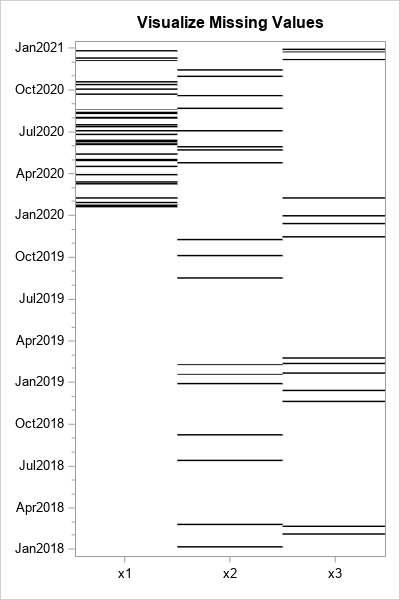
Visualize dependencies of missing values

A SAS programmer asked how to create a graph that shows whether missing values in one variable are associated with certain values of another variable. For example, a patient who is supposed to monitor his blood glucose daily might have more missing measurements near holidays and in the summer months