I don't often use the SG annotation facility in SAS for adding annotations to statistical graphics, but when I do, I enjoy the convenience of the SG annotation macros. I can never remember the details of the SG annotation commands, but I know that the SG annotation macros will create an annotation data set that contains the correct variable names and values.
This article shows a simple example of using an annotation macro to overlay an image on a graph. The documentation shows other examples, such as drawing arrows, lines, polygons, and text.
What is the SG annotation facility in SAS?
To demonstrate the need for the SG annotation macros, let's review the basics of the SG annotation facility.
The SG annotation facility requires that you specify a sequence of function calls that draw various graphical objects such as lines, polygons, text, and so forth. However, the syntax of the "function calls" is a little unusual. You specify the function calls by creating a SAS data set, called the annotation data set. The variables in the data set define the name of the function and the parameters to the function. The names of the variables must exactly match a pre-defined list of variable names. Basically, variables in the data set define parameters (required and optional) and each row (or contiguous sequence of rows) defines a function call.
Some variables are mandatory; others are optional. For example, you must have a variable named FUNCTION. The rows specify the functions that will draw the graphical objects. The location of the object is specified by using the X1 and Y1 variables, but some objects (such as line segment) require additional variables (X2 and Y2). Some variable names are shared among many function calls, whereas others are unique to one function call.
Example: Add an image to a graph
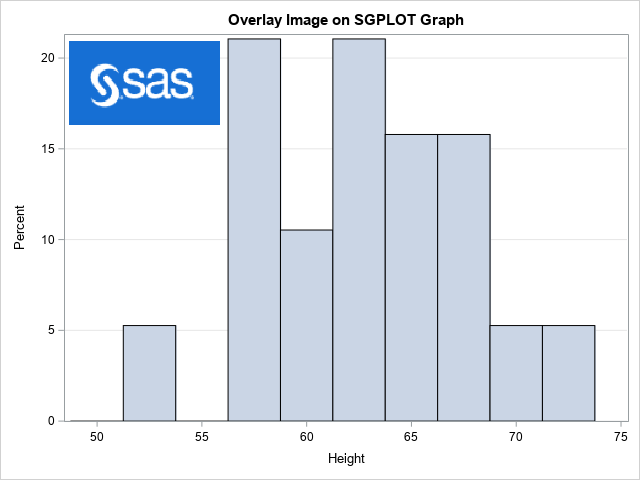
I find it challenging to create an annotation data set that specifies multiple function calls. To give you a feeling for what is involved, the following data set manually specifies the "Image" function. The Image function inserts an image into a graph. For this demo, I used image-capture software to save the SAS logo (which I found on one the sas.com website) to the file C:/Temp/SASLogo.png. The goal is to put the image in the upper left corner of a histogram. To achieve this goal, you must create an annotation data set that specifies a call to the "Image" function. You can then create a histogram and use the SGANNO= option on the PROC SGPLOT statement to add the image to the histogram, as follows:
%let imagePath = C:/Temp/SASLogo.png; /* location of the png file */ data anno; retain function 'image' image 'C:/Temp/SASLogo.png' width 150 widthunit 'pixel' drawspace 'wallpercent' x1 1 y1 98 anchor 'topleft'; run; title "Overlay Image on SGPLOT Graph"; proc sgplot data=sashelp.class sganno=anno; /* use SGANNO= option to run the Image function */ histogram height / binwidth=2.5; yaxis grid; run; |
To create the annotation data set, I must look up the names of the variables for each option in the Image annotation function. This process must be done carefully because specifying a wrong name does not necessarily result in an error message; some mistakes are silently ignored. (Warren Kuhfeld's %ANNOCHECK macro is one way to check that your annotation data set does not have an obvious mistake.)
The SG annotation macros
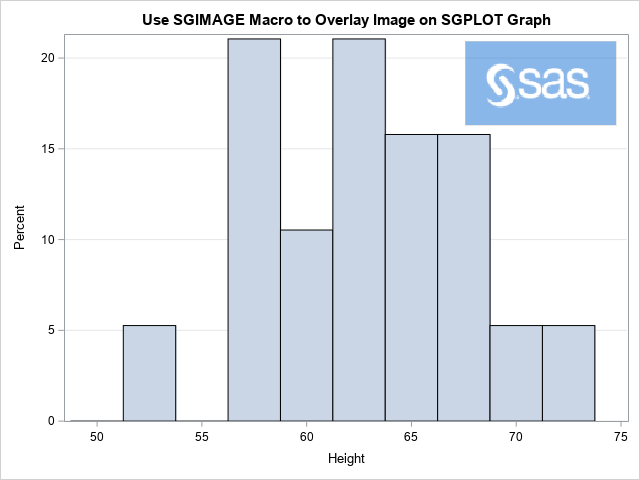
I think it is slightly easier to use the SG annotation macros to create an annotation data set. The SG annotation macros are distributed with SAS software. You define the macros by running the %SGANNO autocall macro. You can then call the individual macro to define the various functions in the annotation data set. To me, using the macros makes it look like I am defining function calls rather than rows in a data set. For example, the following DATA step uses the %SGIMAGE macro to define the Image annotation function. For this call, I put the image in the upper right corner and make it semi-transparent.
%SGANNO; /* compile the annotation macros (Do this only once.) */ data anno; %SGIMAGE(image='C:/Temp/SASLogo.png', x1=71, y1=98, anchor="topleft", border="true", drawspace="wallpercent", transparency=0.5, width=150, widthunit="pixel" ); run; title "Use SGIMAGE Macro to Overlay Image on SGPLOT Graph"; proc sgplot data=sashelp.class sganno=anno; histogram height / binwidth=2.5; yaxis grid; run; |
I still need to look at the documentation, but using the macro makes the code more readable. The macro makes it look like I am defining a function call. Furthermore, the macro will report errors if I try to use a keyword-value pair that is unsupported.
Help on the SG annotation macros
In addition to the SAS documentation, you can use the %SGANNO_HELP macro to obtain a short summary of the syntax for each macro. To get a list of the available macros, submit
%sganno_help(); |
The log will contain the names of the supported SG annotation macros. You can pass the name of a macro to the %SGANNO_HELP macro to obtain a short summary of the syntax. For example, the following call displays the syntax of the %SGIMAGE macro to the log:
%sganno_help(sgimage); |
Summary
The SG annotation facility is a way to overlay graphical objects on a statistical graph. It enables you to manually specify the location of arrows, text, polygons, and other graphical objects. You use an annotation data set to specify the function calls. It can be challenging to plan and create an annotation data set. By using the SG annotation macros, the process becomes a little easier.
Further reading
- Documentation for the SG annotation system
- Documentation for the SG annotation macros
- Heath, D. (2016) "Annotating the SAS ODS Graphics Way!"
