One thing I have learned about rank-based statistics over the years is "Be careful of tied values!" On multiple occasions, I have been asked, "Why doesn't the SAS result for [NAME] statistic agree with my hand calculation?" The answer is sometimes because of the way that tied values are handled. Tied values can also affect the agreement of results between different software packages, such as SAS, R, and Python.
For rank-based measures of correlation, Kendall's tau statistic is often used to describe the association between two random variables. However, there are three common rank-based statistics that are named "Kendall's tau statistic." They each estimate the strength of association between two variables, but they differ in the way that they handle tied values. Each statistic appears somewhere in SAS, but they have different uses, so they appear in different procedures.
This article gives a brief introduction to Kendall's tau-a, tau-b, and tau-c statistics and where they can be found in SAS. See the Wikipedia article, "Kendall rank correlation coefficient," to see the formulas for each statistic.
Example data
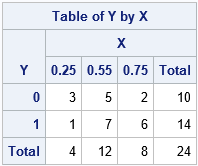
Kendall's tau-a is related to Somers' D statistic, so let's use some data from the Wikipedia article about Somers' D statistic. The following data describes 24 observations for two variables, X and Y. The X variable is a discrete explanatory variable with the values 0.25, 0.5, and 0.75. The response variable, Y, is binary with the values 0 and 1. The following SAS DATA step defines the data. A frequency variable is used to save typing. A table of counts is shown to the right.
data Have; input X Y Freq; datalines; 0.25 0 3 0.55 0 5 0.75 0 2 0.25 1 1 0.55 1 7 0.75 1 6 ; |
You can analyze these data in a few ways:
- Is there an association between X and Y? You can answer this question by using PROC FREQ to analyze the 2 x 3 table of counts for the (x,y) pairs.
- You can answer the same question by using PROC CORR to compute the (Kendall) correlation between X and Y. Whereas inferences based on the Pearson correlation assume bivariate normality, you can use Kendall's measure of association on discrete data like these.
- You can construct a predictive model that uses the explanatory variable, X, to explain the binary response, Y. Use PROC LOGISTIC to construct a logistic model of the data.
These data contain many tied values, so they are an ideal example to show how the various definitions of Kendall's tau differ.
Association between discrete variables
You can use PROC FREQ to analyze the 2 x 3 table of counts for the unique combinations of (x,y) pairs. Use the MEASURES option on the TABLES statement to get Kendall's tau-b and tau-c statistics, as well as related statistics such as Somers' D. You can use the CL option to obtain confidence intervals for the statistics.
proc freq data=Have; weight Freq; tables Y*X / measures CL norow nocol nopercent; run; |
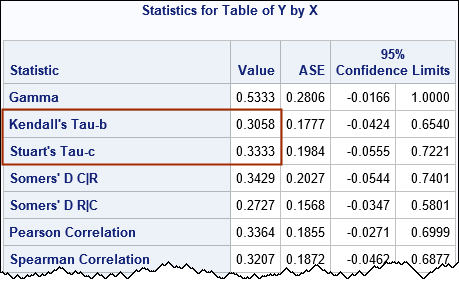
Kendall's tau-c statistic is also known as the Stuart-Kendall tau-c statistic, so it is labeled as "Stuart's tau-c" in the output from PROC FREQ. You can see that the confidence intervals for the tau-b and tau-c statistics include 0, which means that we cannot conclude that these corresponding parameters are different from 0. Briefly, we cannot conclude that the X and Y variables are associated. The Wikipedia article on Kendall's rank statistics states that the tau-c statistic "is more suitable than tau-b for the analysis of data based on non-square (i.e. rectangular) contingency tables."
Kendall's rank correlation
We often use correlation to analyze relationships between two continuous variables, but Kendall's rank correlation is applicable to discrete variables a well. You can use PROC CORR and the KENDALL option to obtain Kendall's correlation in SAS, as follows:
proc corr data=Have kendall; freq Freq; var X Y; run; |
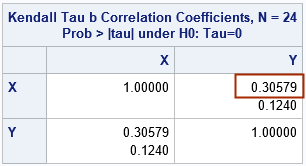
The output table shows that the rank correlation is 0.30579, which is exactly the value of tau-b that was reported in the previous section. The table shows that the two-sided p-value for the null hypothesis of zero correlation is 0.124. Since this is larger than 0.05, we cannot reject the null hypothesis that the variable are uncorrelated.
Concordant and discordant statistics
If you look at the definition of Kendall's statistics, you will see that they all depend on whether pairs of observations are concordant, discordant, or tied. When the Y variable is binary, you can use PROC LOGISTIC to obtain the values that are used to compute Kendall's statistics, including the tau-a statistic. The following call to PROC LOGISTIC models the probability that Y=0 by using the values of the discrete explanatory variable, X.
title "Model Y ~ X"; proc logistic data=Have plots=none; class X; freq Freq; model Y = X; ods select Association; run; |
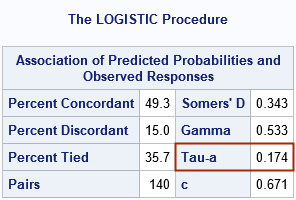
The tau-a is a simple statistic does not adjust for tied values. The table shows the percentage of (x,y) pairs that are concordant, discordant, and tied. To convert the percentages to counts, multiply each percentage by the count of pairs (fourth row, left side) and divide by 100. For this example, the counts are as follows:
- Number Concordant: NC = 49.3 * 140 / 100 = 69.
- Number Discordant: ND = 15 * 140 / 100 = 21.
- Number Ties: NT = 35.7 * 140 / 100 = 50.
These counts are used to create all the Kendall tau statistics.
Summary
Kendall's tau statistic is often used to describe the association between two random variables. However, there are three common rank-based statistics that are named "Kendall's tau statistic": tau-a, tau-b, and tau-c. They each estimate the strength of association between two variables, but they differ in the way that they handle tied values. If the variables are continuous, you can use PROC CORR and the KENDALL option to obtain the tau-b statistic, which is a rank-based correlation. If both variables are discrete, you can use PROC FREQ and the MEASURES option to obtain the tau-b and tau-c statistics. If one variable is binary, you can use PROC LOGISTIC to obtain the tau-a statistic and the counts of the concordant and discordant pairs of observations.

4 Comments
Hi Rick, thank you! Wonderful article.
Only an observation,in the part Concordant and discordant statistics
You didnt write the Proc Logistic code, de code is the same of the previous part,
Thanks Rick,
Thanks. Fixed!
How can I get Z statistics from PROC CORR or any other procedure for Kendall Tau b? I can get Kendall tau value from proc corr but not z-statistics
I assume you mean the z statistic that corresponds to the null hypothesis that the variables are independent. In PROC CORR, the two-sided p-value for the null hypothesis is displayed under the tau-b value. In the example, the two-sided p-value is 0.124. The z statistic for that probability is
z = quantile("Normal", p/2) = 1.538.