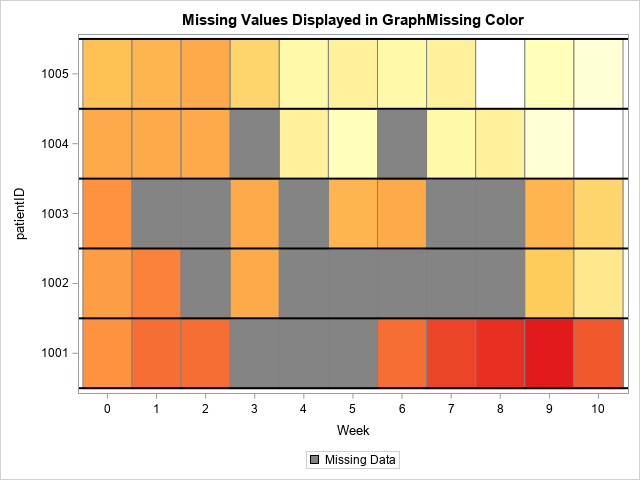
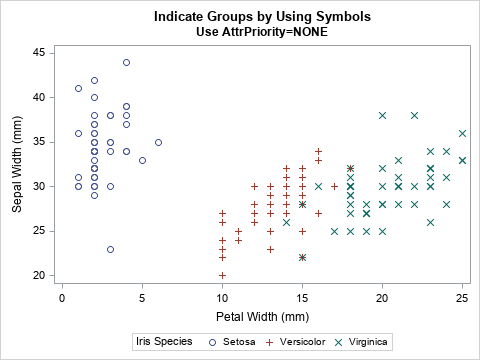
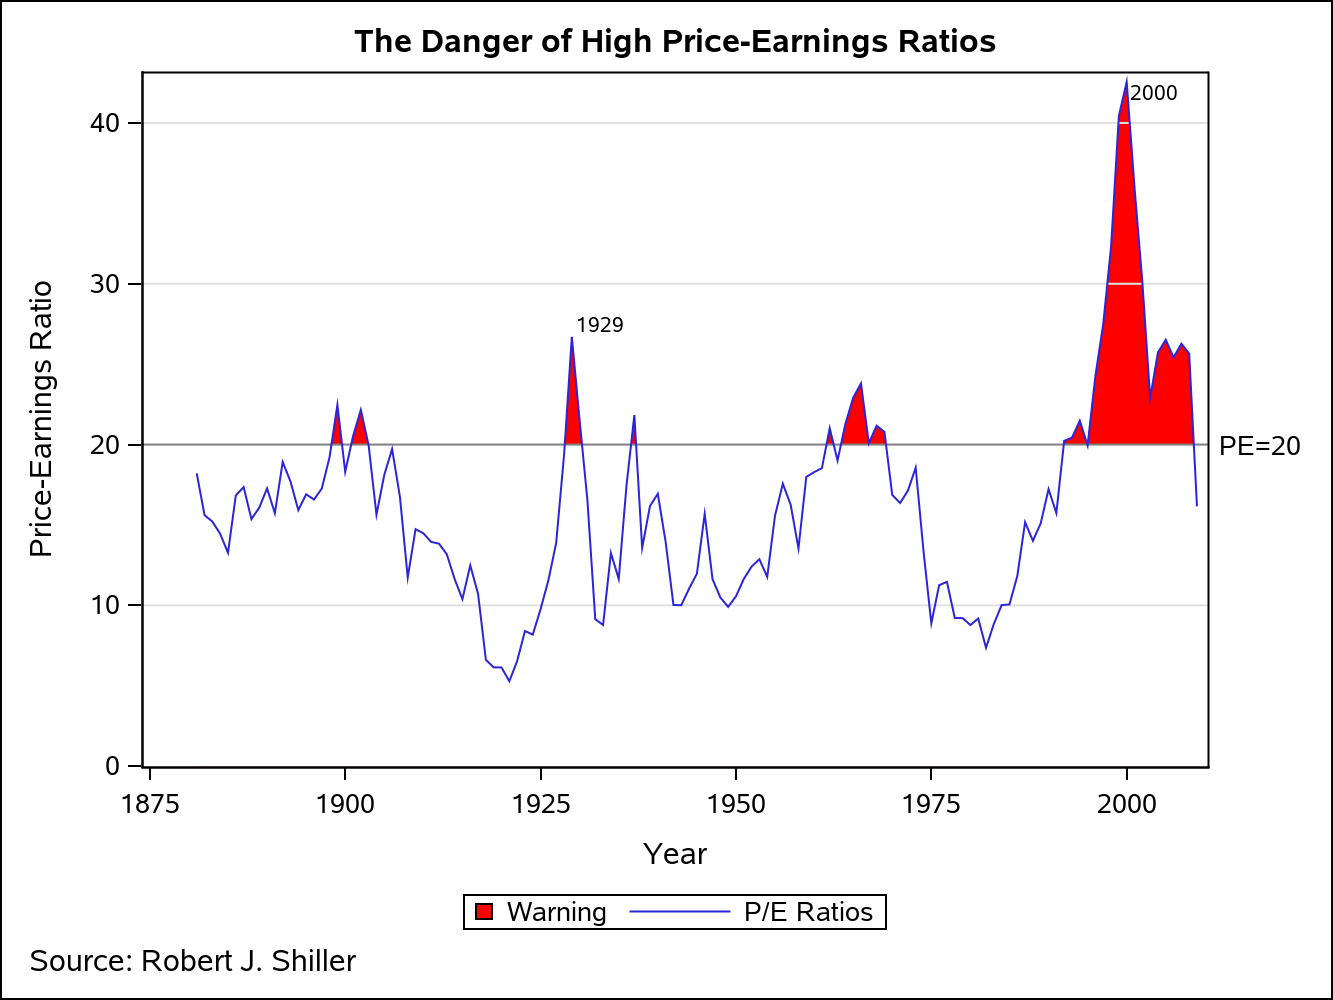
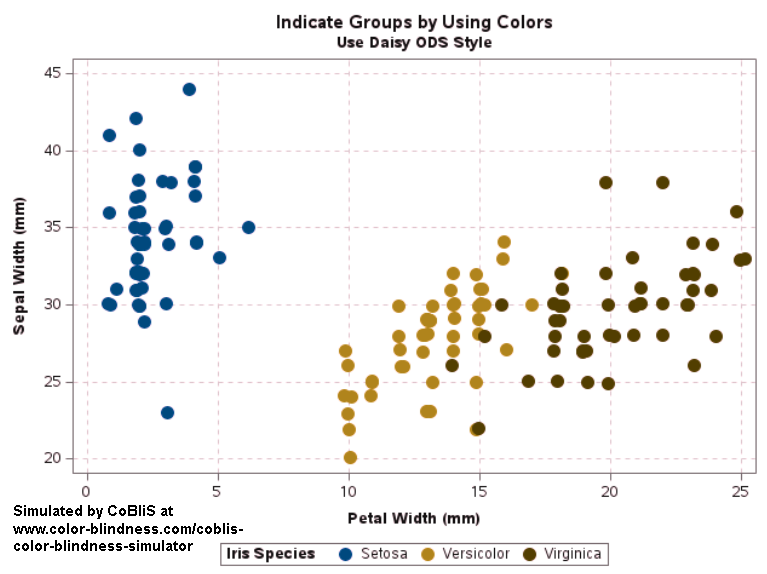
Search Results: sgplot (969)

Analytics | Data Visualization | Learn SAS
Rick Wicklin 0
Visualize how parameters in a binary logistic regression model affect the probability of the event

A previous article shows that you can use the Intercept parameter to control the ratio of events to nonevents in a simulation of data from a logistic regression model. If you decrease the intercept parameter, the probability of the event decreases; if you increase the intercept parameter, the probability of

Analytics | Programming Tips
Rick Wicklin 0
Simulate data from a logistic regression model: How the intercept parameter affects the probability of the event

This article shows that you can use the intercept parameter to control the probability of the event in a simulation study that involves a binary logistic regression model. For simplicity, I will simulate data from a logistic regression model that involves only one explanatory variable, but the main idea applies

Advanced Analytics | Machine Learning
Kevin Scott 0
SAS® Fast-KPCA: An efficient and innovative nonlinear principal components method

SAS® Fast-KPCA implementation bypasses the limitations of exact KPCA methods. SAS® internally uses k-means to find a representative sample of a subset of points. This row reduction method has the advantage that c centroids are chosen to minimize the variation of points nearest to each centroid and maximize the variation to the other cluster centroids. In some cases, the downstream effect of using k-means on computing the SVD increases numerical stability and improves clustering, discrimination, and classification.

Analytics | Learn SAS
Rick Wicklin 0
The noncentral t distribution in SAS

The noncentral t distribution is a probability distribution that is used in power analysis and hypothesis testing. The distribution generalizes the Student t distribution by adding a noncentrality parameter, δ. When δ=0, the noncentral t distribution is the usual (central) t distribution, which is a symmetric distribution. When δ >

Data Visualization
Dan Heath 0
The Power of Stacking

Amazing things can be created when you start with small pieces and stack them together. Just ask Bryan Berg. He is the current world record holder for the tallest house of cards. This same principle can be applied to the SGPLOT and SGPANEL procedures. You can take the individual plot

Data Visualization
Dan Heath 0
Optimizing bar label placement

When creating bar charts, it is very common to display labels with the bars to make it easier to determine the bar values or to provide additional information in the chart. However, these labels can take away valuable data space, particularly if you generate a smaller-sized graph. As you see

1 4 5 6 7 8 33