The Graph Template Language (GTL) is a powerful tool for creating a wide range of graphic displays. One feature GTL has is the ability to combine independent plots together into one paneled display. The SG procedures have some limited capabilities in this area; but in this post, I am going to show you how you can take SG procedure output from one or more procedures and combine it all into one image (Actually, this technique can be used with any ODS output, including tables.).
This technique boils down to two features in SAS:
- The ability to arrange output using ODS LAYOUT. Rick Wicklin has a recent post called, "Use ODS to arrange graphs in a panel" that has some good examples of using this feature.
- The ability of the ODS PRINTER destination to "print" to an image.
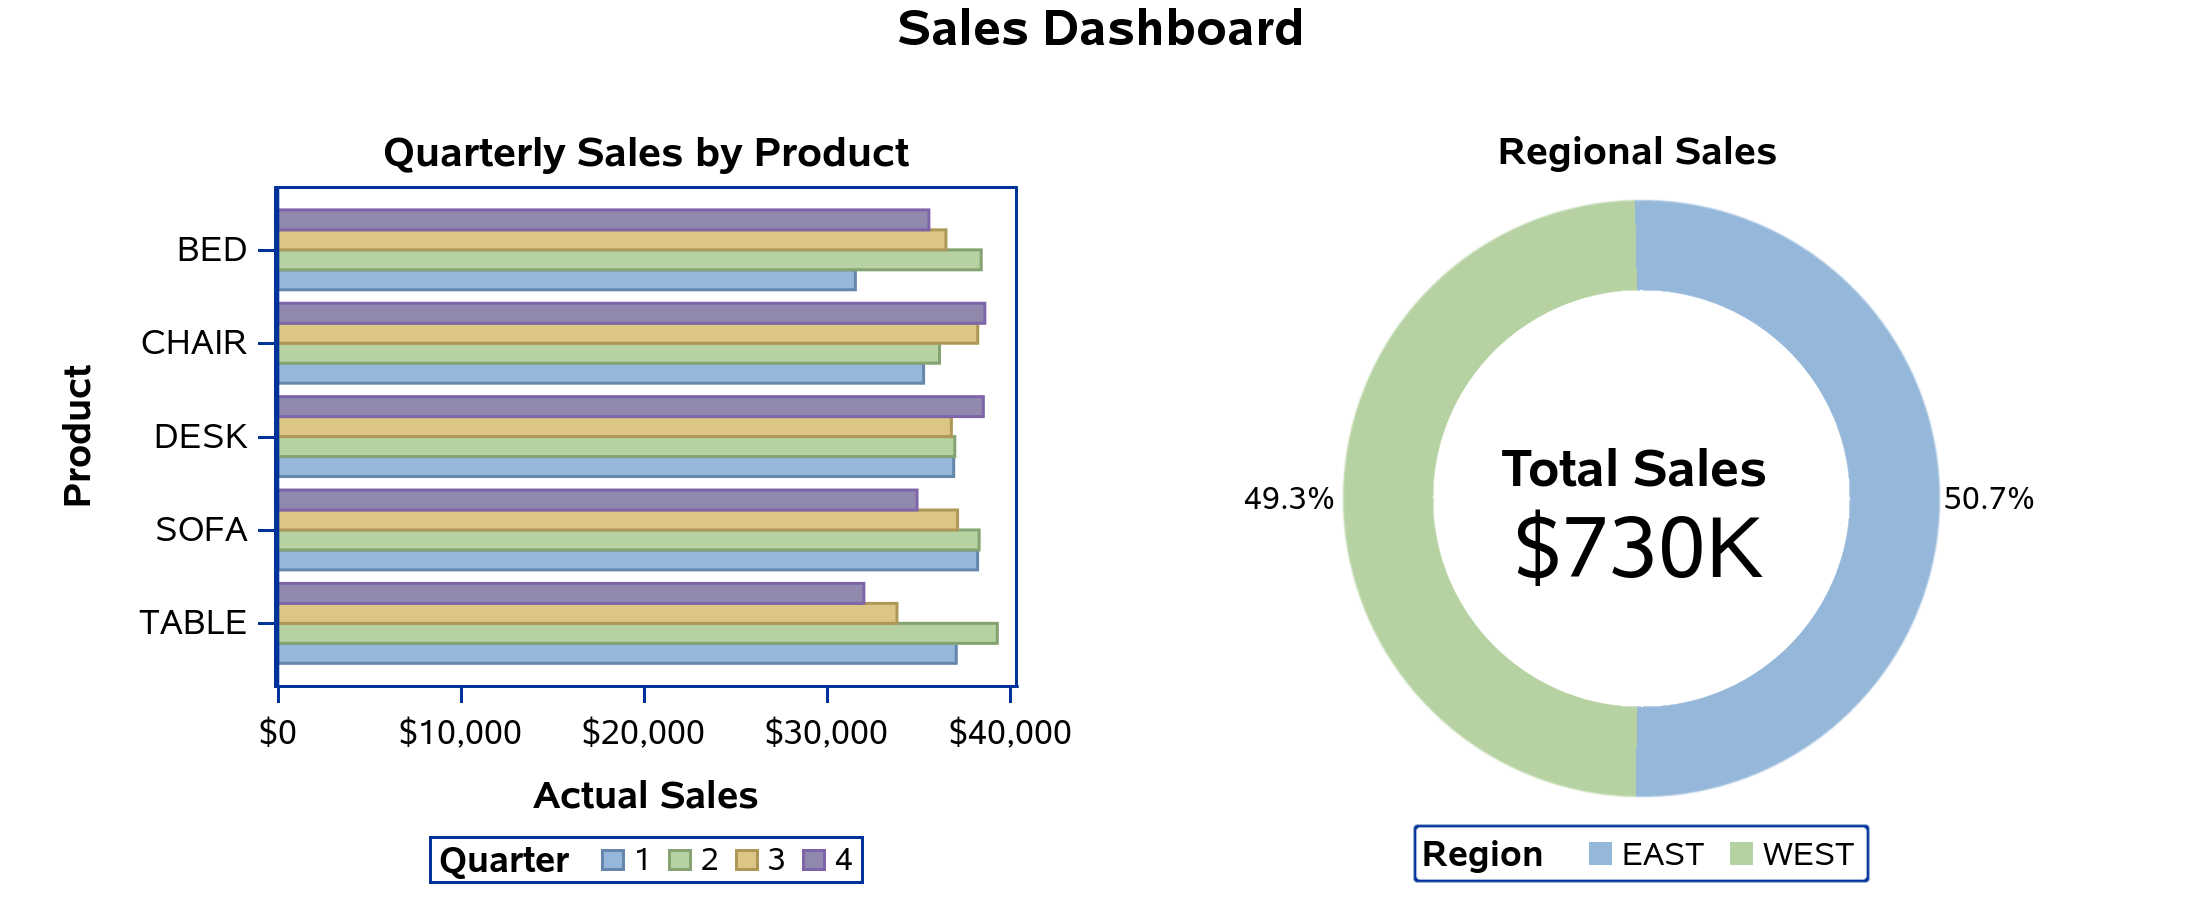
This first example combines the output of both the SGPLOT and SGPIE procedures into one image.
ods _all_ close;
options nodate nonumber;
options leftmargin="0.001in" rightmargin="0.001in";
options papersize=(7.35in 3.00in);

title "Sales Dashboard";
ods printer printer=png300 file="dashboard.png" style=normalprinter;

ods layout gridded columns=2 advance=proc
    column_gutter=0.1in row_gutter=0.1in;

ods graphics / width=3.5in noborder;

title "Quarterly Sales by Product";
proc sgplot data=sashelp.prdsale;
hbar product / response=actual group=quarter groupdisplay=cluster;
run;

title "Regional Sales";
proc sgpie data=sashelp.prdsale;
donut region / response=actual holevalue datalabeldisplay=(percent)
               holelabel="Total Sales" datalabelloc=outside;
run;

ods layout end;
ods printer close;
First, let's talk about the options. The first option statement turns off the date and page number from the output, which you typically would not want in your image. The second option statement basically turns off the left and right margins. You cannot specify zero here, so just specify a very small number. Finally, the last option statement sets the PAPERSIZE. Since we are printing to an image, the PAPERSIZE option defines the size of the image. All of your ODS output is going into this image, so the output needs to be sized appropriately to fit. More on that in a moment...
To have an "overarching" title for the display, make sure to define the TITLE statement before the ODS PRINTER statement so that it is treated as a "page" title. Later in the program, I change the title for each graph procedure output, which has no effect on the page title. If you do not want a page title, be sure to specify "title;" before the ODS PRINTER statement to turn off the system title.
Notice the PRINTER option on the ODS PRINTER statement. Here, I have specified a PNG300 device, which outputs a high-resolution, 300dpi PNG image. Other image devices can be specified here as well.
The ODS LAYOUT statement starts the layout for the output going into the image. The layout type is GRIDDED, which should be used instead of ABOSLUTE for this technique. I have specified a two-column layout, which means that the output will be next to each other in the same row. Instead of using ODS REGION statement before each procedure to define each cell in the layout, I used the ADVANCE option to tell ODS to advance to the next cell on each procedure boundary. The GUTTER options are used to control the spacing between the layout cells.
On the ODS GRAPHICS statement, I used the NOBORDER option so that the border that normally surrounds each graph is turned off. I also set the WIDTH option control the size of the output. In ODS GRAPHICS, if you set only the width or the height, the original aspect of the graph is maintained. However, using this approach might require a little more trial-and-error to determine the correct size to fit inside the image page, so you might want to specify both WIDTH and HEIGHT in practice.
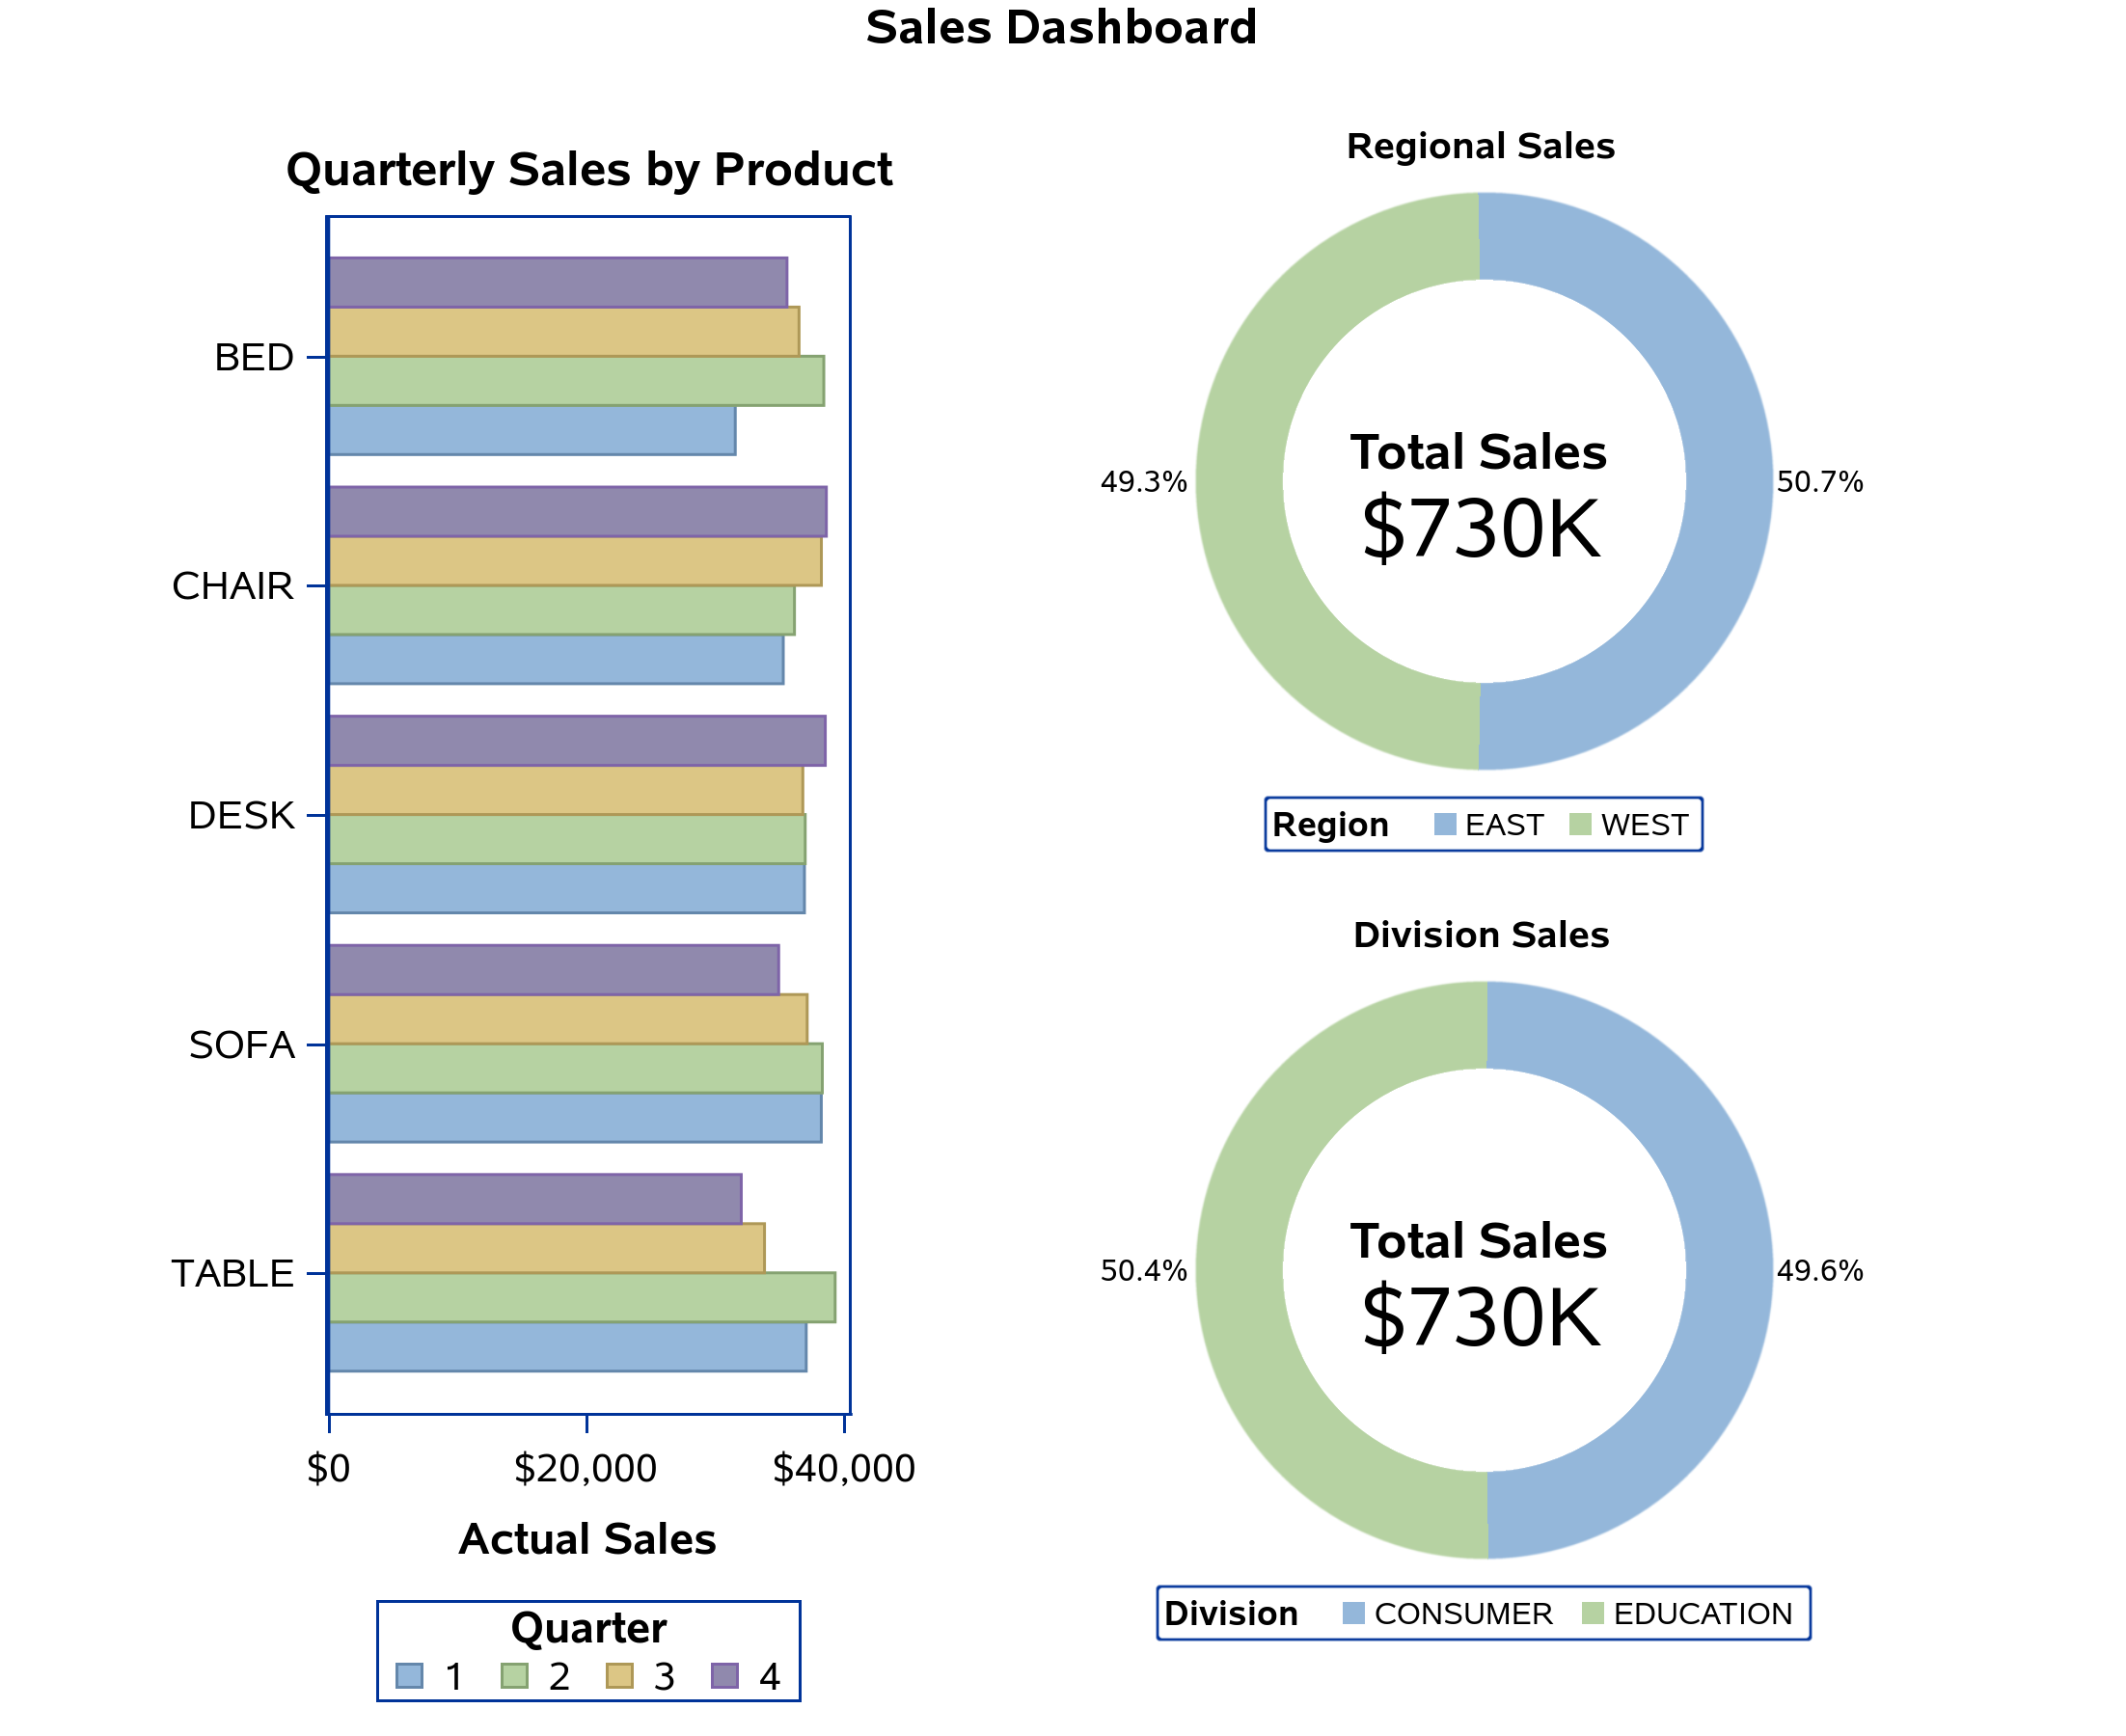
This second example builds on the concepts above to show you how to build more complex graphs using nested layouts.
ods _all_ close;
options nodate nonumber;
options papersize=(7.35in 6.00in);
options leftmargin="0.001in" rightmargin="0.001in";

title "Sales Dashboard";
ods printer printer=png300 file="dashboard2.png" style=normalprinter;

ods layout gridded columns=2 advance=proc
    column_gutter=0.1in row_gutter=0.1in;

ods graphics / reset width=3.5in height=7in noborder;

title "Quarterly Sales by Product";
proc sgplot data=sashelp.prdsale;
yaxis display=(nolabel);
hbar product / response=actual group=quarter groupdisplay=cluster;
run;

ods region;
ods layout gridded rows=2 advance=proc
    column_gutter=0.1in row_gutter=0.1in;

ods graphics / reset width=3.5in noborder;
title "Regional Sales";
proc sgpie data=sashelp.prdsale;
donut region / response=actual holevalue datalabeldisplay=(percent)
               holelabel="Total Sales" datalabelloc=outside;
run;

title "Division Sales";
proc sgpie data=sashelp.prdsale;
donut division / response=actual holevalue datalabeldisplay=(percent)
               holelabel="Total Sales" datalabelloc=outside;
run;

ods layout end; /* two-row layout */
ods layout end; /* two-column layout */
ods printer close;
The goal of this display is to produce a bar chart with two pie charts in the cell next to it. This means that, in addition to the two-column layout, I need a two-row layout in the second cell.
The bar chart is generated in the first cell. Notice that I specified both the WIDTH and the HEIGHT for the chart so that it would fully take up the cell space of the, now taller, image page.
For the second cell, I start the nested two-row layout. Notice that I had to specify the ODS REGION statement to tell ODS to advance to the next cell before starting the layout, as the ODS LAYOUT statement does not produce any output to force an advancement. The ADVANCE option in the second layout is also set to PROC so that the output from each SGPIE procedure populates each cell in the row layout. The size of the SGPIE output was also adjusted using the ODS GRAPHICS statement so that it would be in the correct proportion to the bar chart and fit in the image page.
This last example shows how you can have all of your BY-group output combined into one image.

ods _all_ close;
options nodate nonumber;
options papersize=(7.35in 5.75in);
options leftmargin="0.001in" rightmargin="0.001in";
options nobyline;

data heart;
set sashelp.heart;
if (weight_status eq '') then weight_status="Unknown";
run;
proc sort data=heart; by weight_status; run;

title "Cholesterol Distribution by Weight Status";

ods printer printer=png300 file="bygroups.png" style=normalprinter;
ods layout gridded columns=2 rows=2 advance=bygroup
    column_gutter=0.1in row_gutter=0.1in;
ods graphics / width=3.5in;
title "#byval1";
proc sgplot data=heart noautolegend uniform=xscale;
by weight_status;
yaxis offsetmin=0.05;
histogram cholesterol;
density cholesterol;
fringe cholesterol;
run;
ods layout end;
ods printer close;
For this example, I needed to change the ADVANCE option from PROC to BYGROUP so that the layout would advance to the next cell for each BY-group. You will also want to the NOBYLINE option to turn off automatic BY-lines and use "#by" directives to created custom titles. Otherwise, the page-level title will contain a BY-line, which is not desired. Also note that you will need to know the number of BY-groups in advance so that you can size the output appropriately.
These examples should give you the main concepts for creating this type of output. Hopefully, this will open a door for you to make all kinds of creative displays. Have fun with it!

5 Comments
Great tips! Thanks.
For more information about how to create a panel of plots by using BY groups, with an emphasis on controlling titles, see "How to use the #BYVAR and #BYVAL keywords to customize graph titles in SAS."
On small comment: To suppress output to the non-PRINTER destinations, I recommend using ODS EXCLUDE ALL instead of ODS _ALL_ CLOSE. For my reasons, see "Five reasons to use ODS EXCLUDE to suppress SAS output."
Does this combined-plot technique support mouse-over text (for each of the bar segments, for example), like the individual plots did?
Not when just creating an image, as I was in this case. However, the same layout techniques can be used with the ODS HTML or ODS HTML5 destinations, where you can enable IMAGEMAP support on the ODS Graphics statement. In the HTML case, the graphs are laid out inside of the HTML document, whereas the ODS PRINTER approach was laying them out inside of an image.
Excellent! (Would be nice to see a working example of that as a future blog topic!) 🙂
/*Here is an alternative way.*/
%let path= c:\temp ;
options nodate nonumber;
ods listing gpath="&path." style=htmlblue image_dpi=300;
ods graphics /width=3in height=3in reset=index noborder imagename='FAS' outputfmt=png ;
proc sgplot data=sashelp.class noautolegend ;
reg x=height y=weight/cli clm;
run;
ods graphics /width=3in height=3in reset=index noborder imagename='PPS' outputfmt=png;
proc sgplot data=sashelp.class;
scatter x=age y=weight;
run;
ods graphics /width=3in height=3in reset=index noborder imagename='SS' outputfmt=png ;
proc sgplot data=sashelp.class ;
ellipse x=height y=weight/group=sex;
scatter x=height y=weight/group=sex;
run;
ods graphics /width=3in height=3in reset=index noborder imagename='S' outputfmt=png;
proc sgplot data=sashelp.class;
scatter x=age y=weight/group=sex datalabel=name;
run;
ods pdf file="&path.\want.pdf" style=minimal dpi=300 ;
data x;
x=' ';y=' ';output;
x=' ';y=' ';output;
run;
title;
proc report data=x nowd noheader style={outputwidth=100% };
column x y;
define x/display;
define y/display;
compute y;
n+1;
if n=1 then do;
call define('x','style','style={ preimage="&path\FAS1.png" bordertopcolor=white borderbottomcolor=white borderrightcolor=white borderleftcolor=white}');
call define('y','style','style={ preimage="&path\PPS1.png" bordertopcolor=white borderbottomcolor=white borderrightcolor=white borderleftcolor=white}');
end;
if n=2 then do;
call define('x','style','style={ preimage="&path\SS1.png" bordertopcolor=white borderbottomcolor=white borderrightcolor=white borderleftcolor=white}');
call define('y','style','style={ preimage="&path\S1.png" bordertopcolor=white borderbottomcolor=white borderrightcolor=white borderleftcolor=white}');
end;
endcomp;
run;
ods pdf close;