The ODS GRAPHICS statement in SAS supports more than 30 options that enable you to configure the attributes of graphs that you create in SAS. Did you know that you can display the current set of graphical options? Furthermore, did you know that you can temporarily set certain options and then restore the options to their previous values? This article shows how to use the SHOW, PUSH, POP, and RESET options on the ODS GRAPHICS statement.
SHOW the ODS GRAPHICS options
ODS graphics have a default set of characteristics, but you can use the ODS GRAPHICS statement to override the default characteristics for graphs. Probably the most familiar options are the WIDTH= and HEIGHT= options, which set a graph's horizontal and vertical dimensions, respectively. For example, the following ODS GRAPHICS statement resets all options to their default values (RESET) and then sets the dimensions of future graphs. You can use the SHOW option on the ODS GRAPHICS statement to list the default value of several graphical options:
ods graphics / reset width=480px height=360px;
ods graphics / SHOW; |
The SAS log shows the value of many options. The first few lines are shown below:
ODS Graphics Settings --------------------- Output format: STATIC By line: NOBYLINE Antialias: ON Maximum Loess observations: 5000 Image width: 480px Image height: 360px Maximum stack depth: 1024 Stack depth: 0 ... other options omitted ... |
The log reports that the width and height of future graphs are set to 480 pixels and 360 pixels, respectively. Note that the "stack depth" is set to 0, which means that no options have been pushed onto the stack. I will say more about the stack depth in a later section.
To demonstrate that the new options are in effect, the following call to PROC SGPLOT creates a scatter plot of two variables in the SasHelp.Iris data set and uses the GROUP= option to visualize the three different species of flowers in the data:
title "Indicate Groups by Using GROUP= Option"; title2 "HTML Destination Uses AttrPriority=COLOR"; proc sgplot data=sashelp.iris; scatter x=PetalWidth y=SepalWidth/ group=Species; run; |
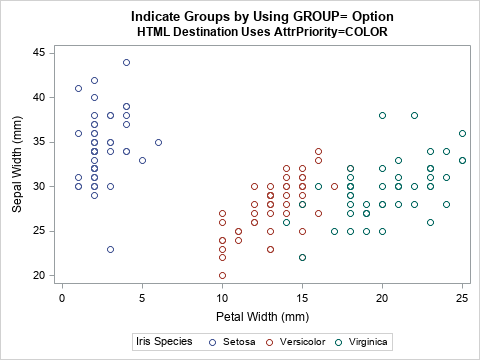
This image shows what the graph looks like in the HTML destination, which uses the ATTRPRIORITY=COLOR option by default. When you use the ATTRPRIORITY=COLOR option, groups are visualized by changing the color of markers (or lines). Thus, some markers are blue, others are reddish, and others are green. There is another option (ATTRPRIORITY=NONE), which is used by other ODS destinations, which visualizes groups by changing the color and symbol of markers (and the color and line pattern for lines). For more information about the ATTRPRIORITY= option, see "Getting started with SGPLOT: Style Attributes."
PUSH new options onto the stack
If you override the default value of an option, it will affect all future graphs until you reset the option or end the SAS session. Often, this is exactly what you want to happen. However, sometimes you want to temporarily override options, create some graphs, and then restore the existing set of options. For example, if you are producing code for others to use (such as writing a SAS macro), it is a good programming practice to not change any options that the user has set. For this situation, you can use the PUSH and POP options on the ODS GRAPHICS statement.
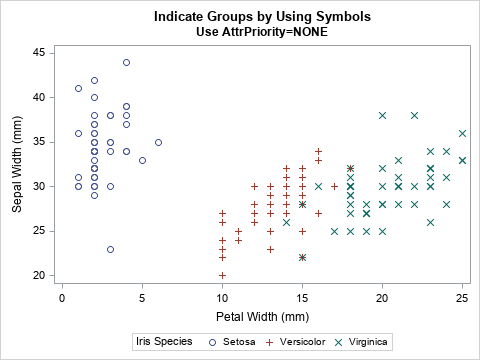
Let's see how the PUSH option works. The following statement temporarily overrides the ATTRPRIORITY= option by pushing the option NONE onto the current stack of options. (If you are not familiar with the stack data structure, read the Wikipedia article about stacks.) The call to PROC SGPLOT then creates a scatter plot. The scatter plot uses both colors and symbols to visualize the species of flowers.
ods graphics / PUSH AttrPriority=None; /* temporarily change option to NONE */ title "Indicate Groups by Using Symbols"; title2 "Use AttrPriority=NONE"; proc sgplot data=sashelp.iris; scatter x=PetalWidth y=SepalWidth/ group=Species; run; |
You can confirm that the options have changed by using the SHOW option to see the new values of the ODS GRAPHICS options:
ods graphics / SHOW; |
ODS Graphics Settings --------------------- Output format: STATIC By line: NOBYLINE Antialias: ON Maximum Loess observations: 5000 Image width: 480px Image height: 360px Attribute priority: NONE Maximum stack depth: 1024 Stack depth: 1 ... other options omitted ... |
The SAS log confirms that the ATTRPRIORITY= option is set to NONE. In addition, the "stack depth" value is now 1, which means that you have pushed options onto the stack. Additional ODS GRAPHICS statements will affect the state of this stack, but they are "temporary" in the sense that you can use the POP option to restore the previous options, as shown in the next section.
POP the stack to restore old options
If you use the PUSH option to create a new set of options, you can use the POP option to restore the previous options. For example, the following statement pops the stack and displays the current options to the SAS log:
ods graphics / POP;           /* restore previous options */
ods graphics / SHOW; |
ODS Graphics Settings --------------------- Output format: STATIC By line: NOBYLINE Antialias: ON Maximum Loess observations: 5000 Image width: 480px Image height: 360px Maximum stack depth: 1024 Stack depth: 0 ... other options omitted ... |
The log shows that the ATTRPRIORITY= option is no longer set, which means that each destination will use its default behavior. In addition, the stack depth is back to 0, which means that the options that are displayed are the "base" options at the bottom of the stack. Notice that the image width and height are not the default values because those options were set before the first PUSH option was set.
RESET all or some options
Even though the width and height options were set before the first PUSH operation, you can still restore the width and height to their default values. The RESET= option can reset individual options, as follows:
ods graphics / reset=width reset=height; /* restore width and height to default values */ |
You can restore all options to their default values by using the RESET=ALL option. Alternatively, you can use the RESET option without an equal sign.
/* restore all options to default values */ ods graphics / reset=all; /* same as ODS GRAPHICS / RESET; */ |
Summary
The ODS GRAPHICS statement enables you to set options that affect the characteristics of future graphs. If you want to temporarily change the options, you can use the PUSH option to add options to the stack. All future graphs will use those options. You can restore the previous set of options by using the POP option to pop the stack. If you are writing code for others to use (for example, a SAS macro), it is good programming practice to push your options onto a stack and then pop the options after your program completes. In this way, you will not overwrite options that the use of your program has explicitly set.
If you set an option but later want to restore it to its default value, you can use the RESET= option.
