This is the 13th installment of the "Getting Started" series. The STYLEATTRS statement in PROC SGPLOT enables you to override colors, markers, line patterns, fill patterns, and axis break patterns in ODS styles, without requiring you to change the ODS style template. You have been able to modify ODS styles since the early days of ODS, but it is a task that most of us find cumbersome. The STYLEATTRS statement makes it much easier to perform this type of customization. While the statement does not enable you to override all style elements, it enables you to override many of the style elements that you will probably most want to override.
To illustrate, first consider what happens before you specify the STYLEATTRS statement. The following step displays three groups of observations using an attribute priority of none, which both displays different markers for each group and uses different colors for each group.
ods graphics on / attrpriority=none; proc sgplot data=sashelp.iris aspect=1; scatter x=petalwidth y=sepalwidth / group=species; keylegend / location=outside position=right across=1; run; |

The following step displays three groups of observations using an attribute priority of color, which distinguishes groups by color alone.
ods graphics on / attrpriority=color; proc sgplot data=sashelp.iris aspect=1; scatter x=petalwidth y=sepalwidth / group=species; keylegend / location=outside position=right across=1; run; |

The HTMLBlue, Pearl, PearlJ, and Sapphire styles are by default ATTRPRIORITY=COLOR styles. Most other styles are by default ATTRPRIORITY=NONE. You can explicitly specify the attribute priority for all styles. For more information about attribute priority, see Attribute Priorities or search Graphically Speaking.
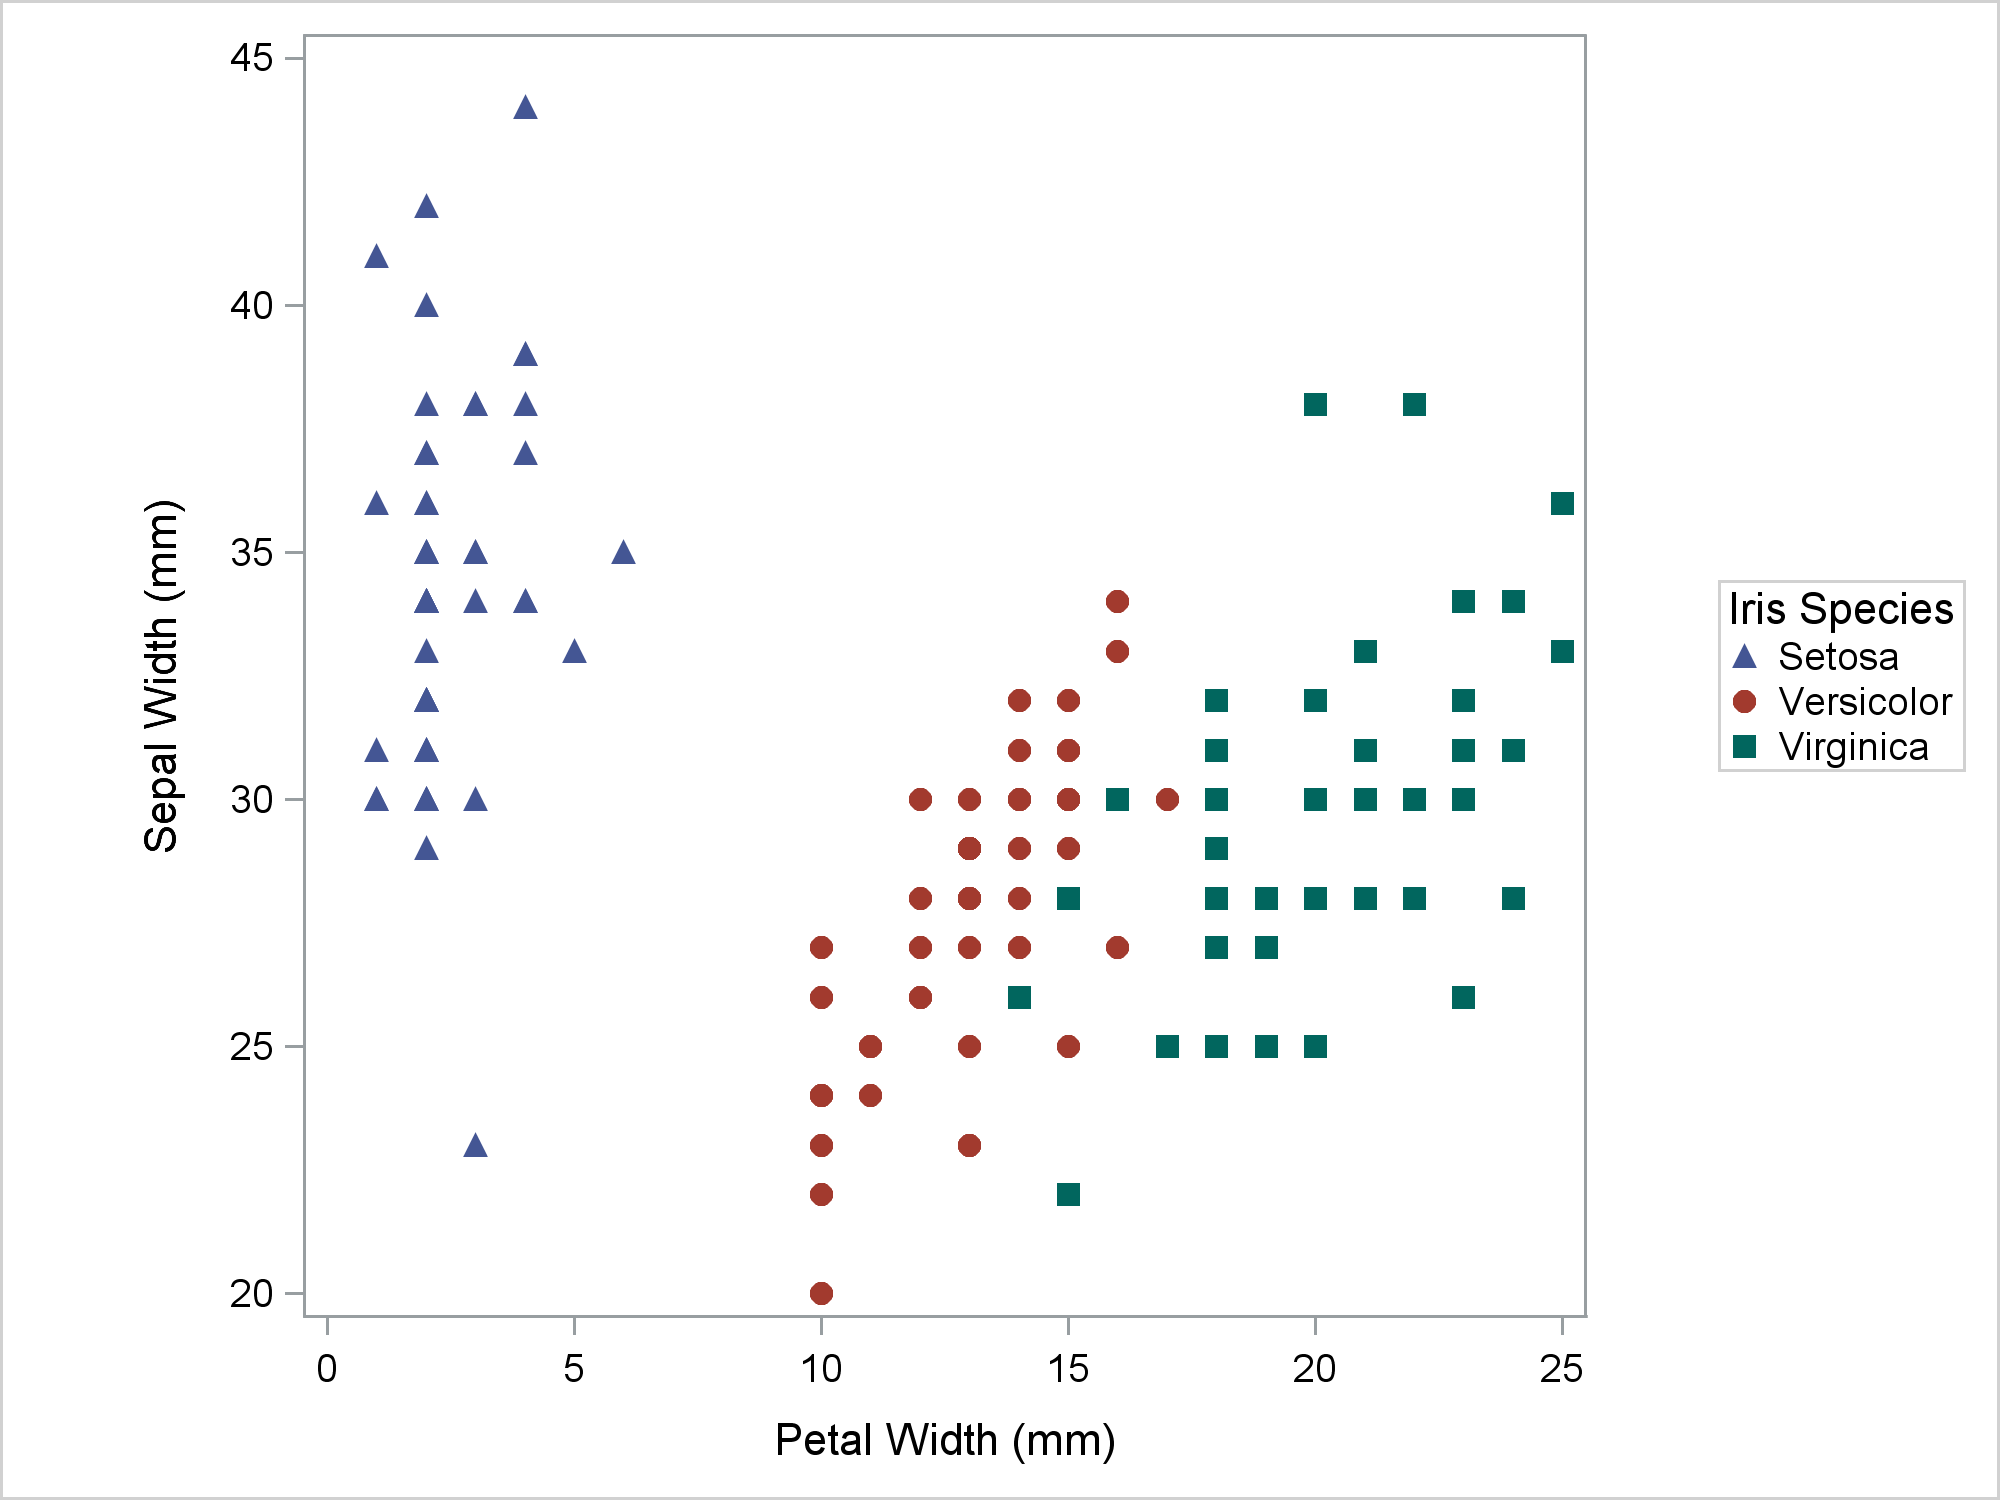
In most cases, you want to use the STYLEATTRS statement along with an attribute priority of none. (See the last part of this post for the exception.) While attribute priority does not change from step to step, I will explicitly specify it for each step to emphasize that I am using ATTRPRIORITY=NONE when I use the STYLEATTRS statement. The following step overrides the markers in the GraphData1 through GraphData3 style elements.
ods graphics on / attrpriority=none; proc sgplot data=sashelp.iris aspect=1; styleattrs datasymbols=(trianglefilled circlefilled squarefilled); scatter x=petalwidth y=sepalwidth / group=species; keylegend / location=outside position=right across=1; run; |
You can override more than markers. The following STYLEATTRS statement options override the GraphData1 through GraphDatan style elements.
DATACOLORS=(color-list)
specifies the fill colors for the graphics elements.
DATACONTRASTCOLORS=(color-list)
specifies the contrast colors for the graphics elements, such as colors for lines and markers.
DATAFILLPATTERNS=(fill-pattern-list)
specifies the graph fill patterns.
DATALINEPATTERNS=(line-pattern-list)
specifies the line patterns for the graph data lines.
DATASYMBOLS=(marker-symbol-list)
specifies the marker symbols for the graph data.
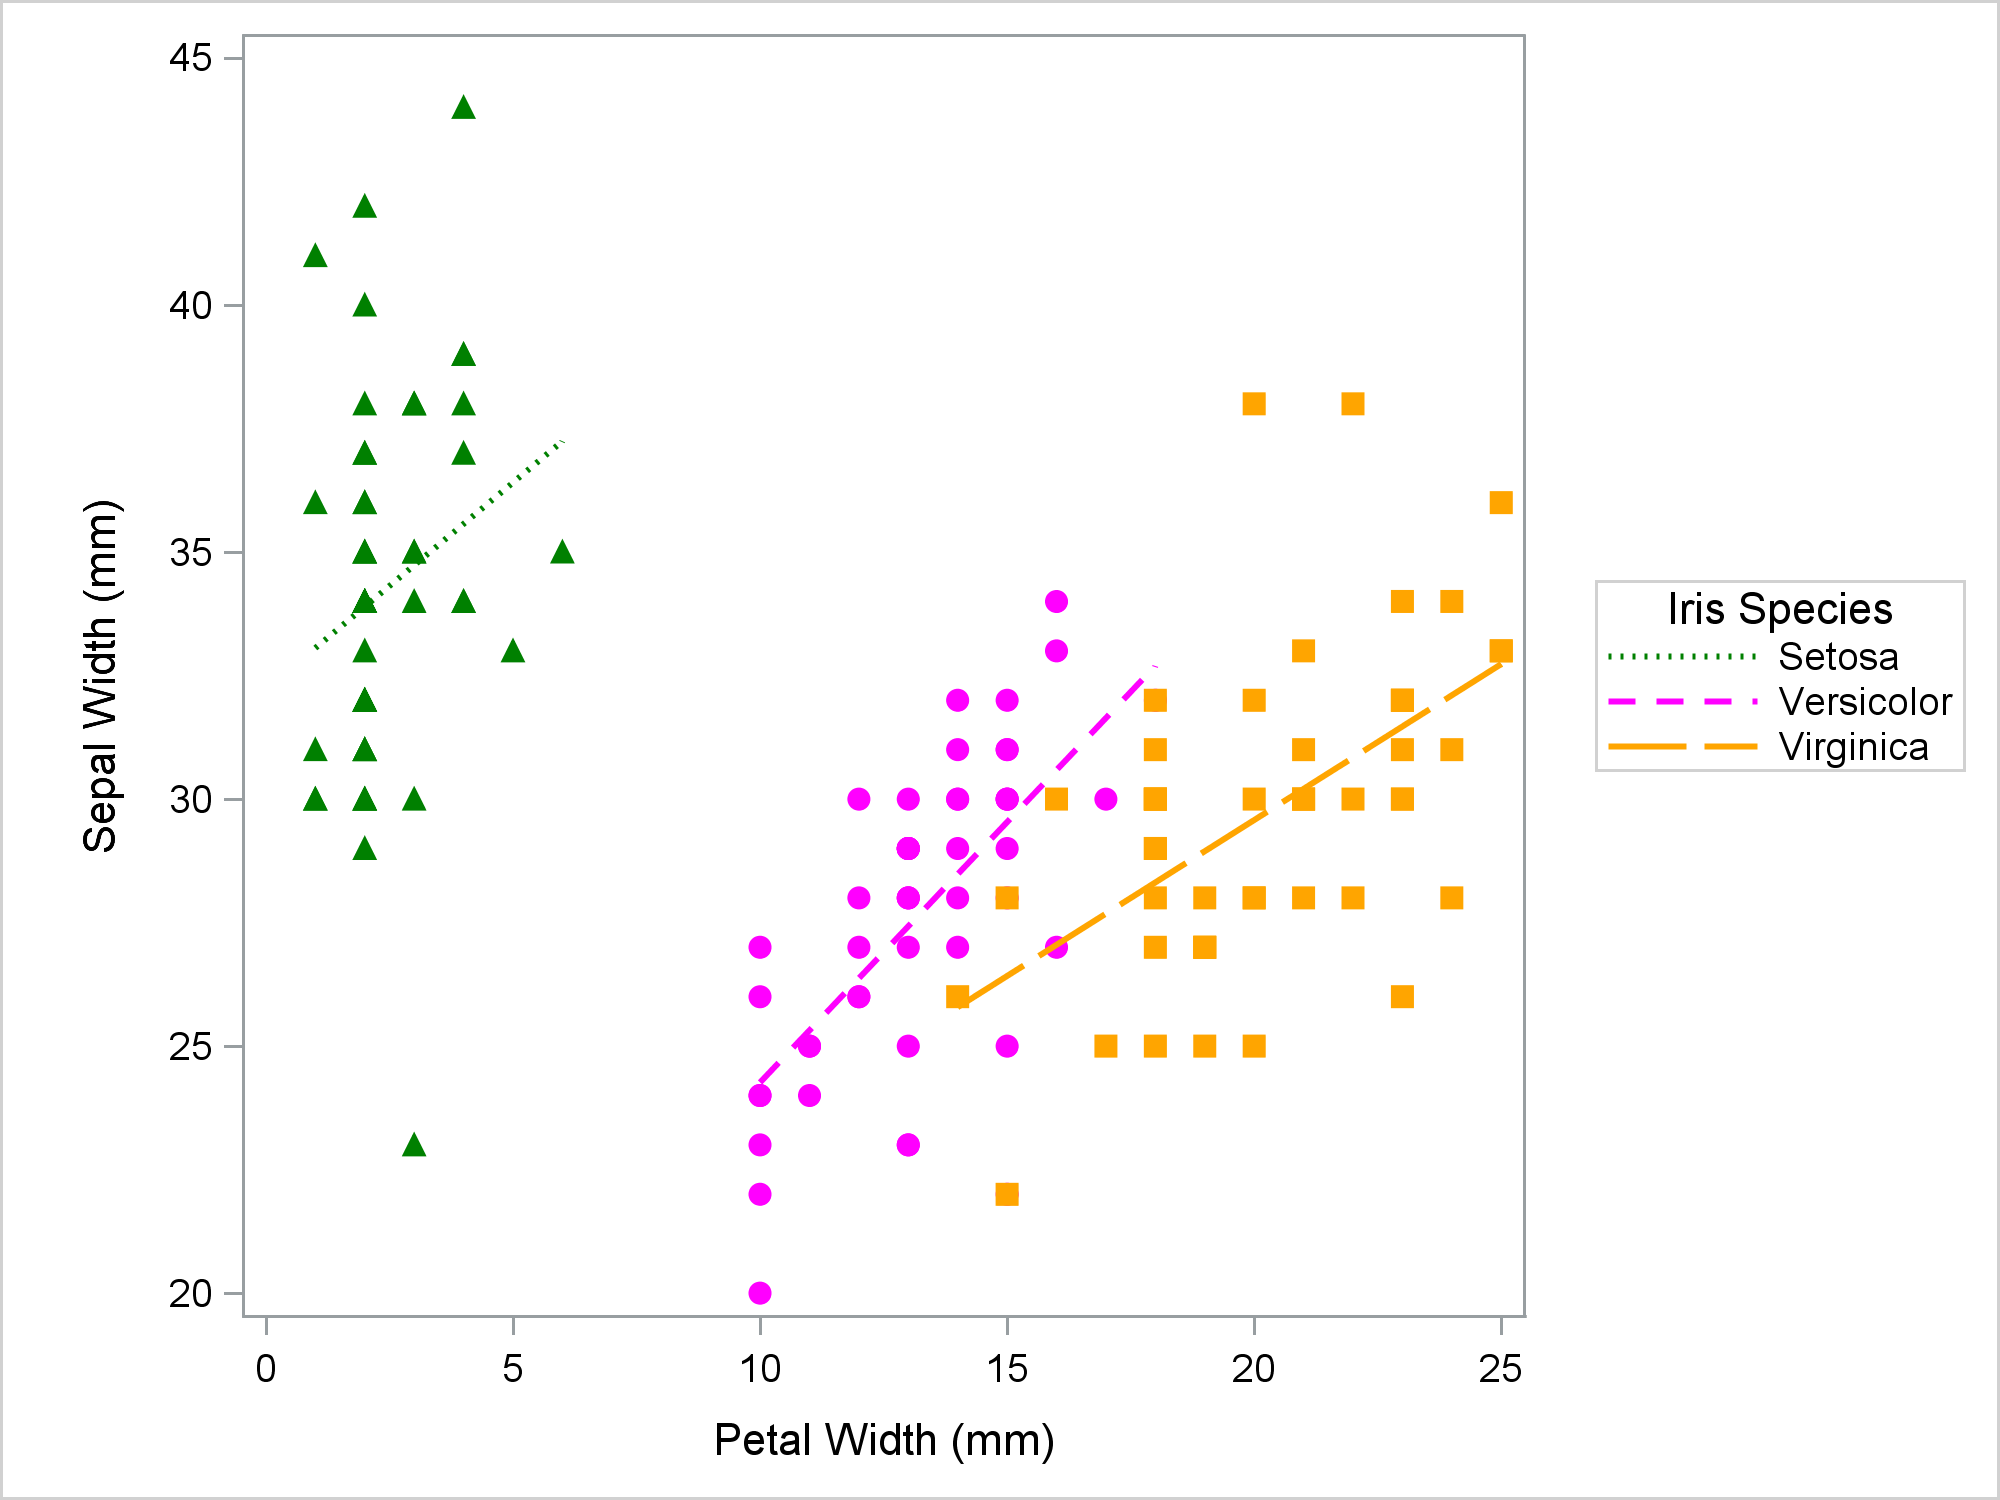
The following step changes the markers, line styles, and their colors.
ods graphics on / attrpriority=none;
proc sgplot data=sashelp.iris aspect=1;
   styleattrs datasymbols=(trianglefilled circlefilled squarefilled)
              datacontrastcolors=(green magenta orange)
              datalinepatterns=(dot dash longdash);
   reg x=petalwidth y=sepalwidth / group=species;
   keylegend / location=outside position=right across=1;
run; |
The following step changes the fill colors and patterns.
ods graphics on / attrpriority=none;
proc sgplot data=sashelp.cars;
   styleattrs datacolors=(green magenta orange)
              datafillpatterns=(r1 l1 x5);
   vbar cylinders / fillpattern group=origin groupdisplay=cluster;
run; |

Options for fill patterns include L1 through L5, R1 through R5, and X1 through X5. For more information, see Fill Patterns.
The STYLEATTRS statement has other options that I will not illustrate here. They include options to specify the symbol for axis breaks and background and wall colors.
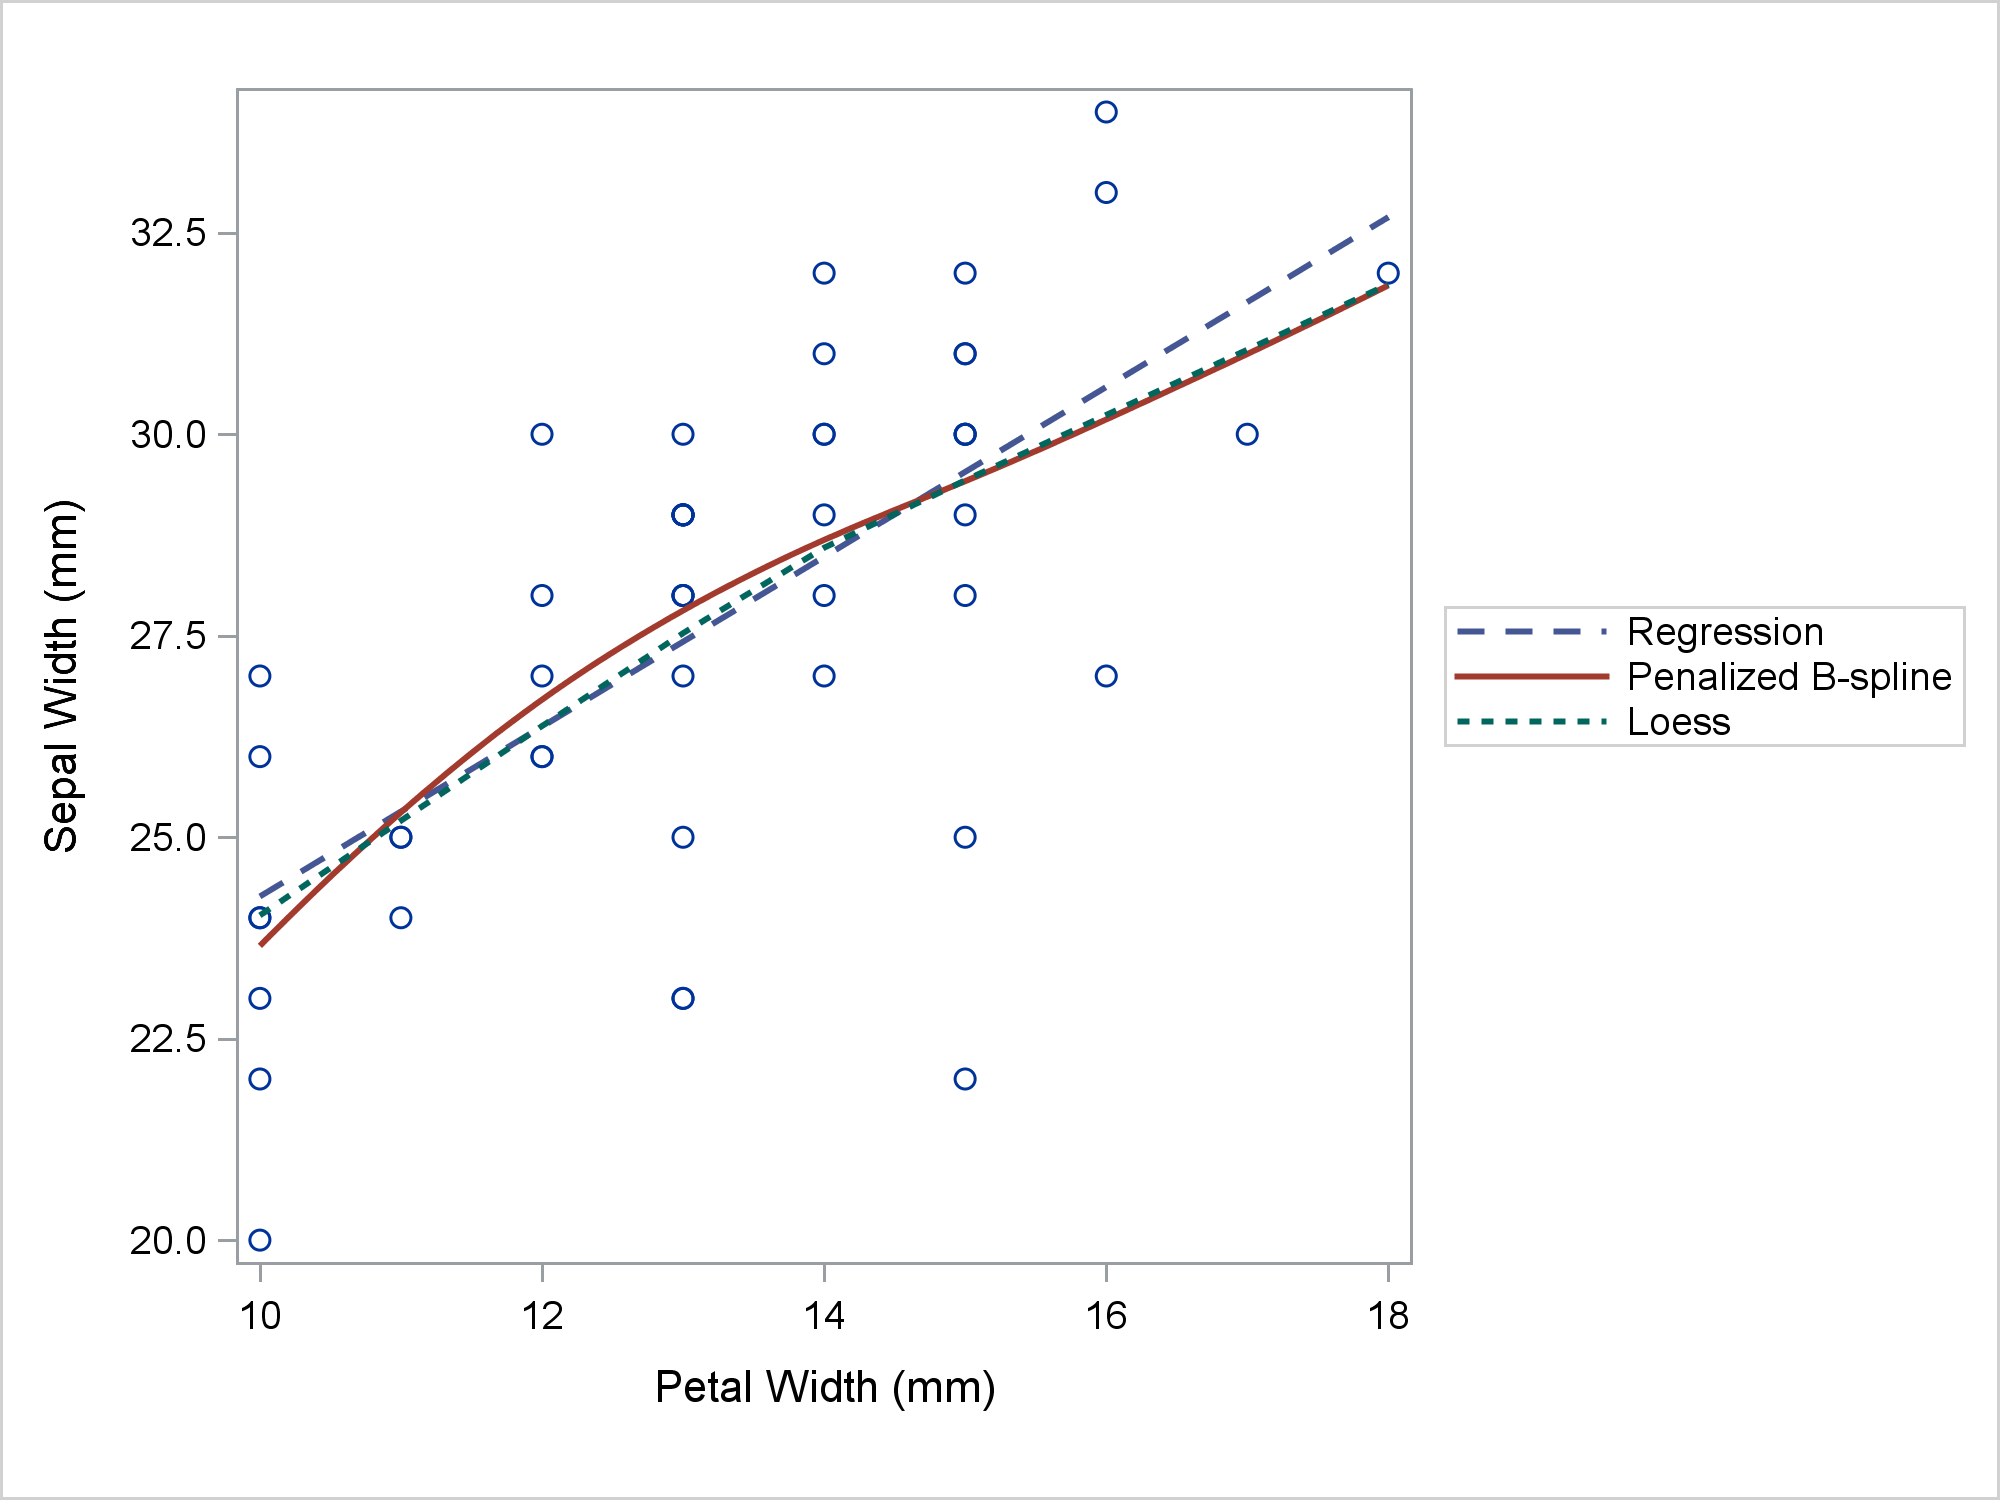
All examples up to this point have a GROUP= option in the plotting statement. You can also use STYLEATTRS in other situations that use the GraphDatai style elements. This example has three statements that provide three fit plots. Due to attribute cycling, the GraphDatai style elements are used for each plot. For more information, see the options CYCLEATTRS | NOCYCLEATTRS.
ods graphics on / attrpriority=none; proc sgplot data=sashelp.iris(where=(species=:'Ve')) aspect=1; styleattrs datalinepatterns=(dash solid shortdash); reg x=petalwidth y=sepalwidth; pbspline x=petalwidth y=sepalwidth / nomarkers; loess x=petalwidth y=sepalwidth / nomarkers; keylegend / location=outside position=right across=1; run; |
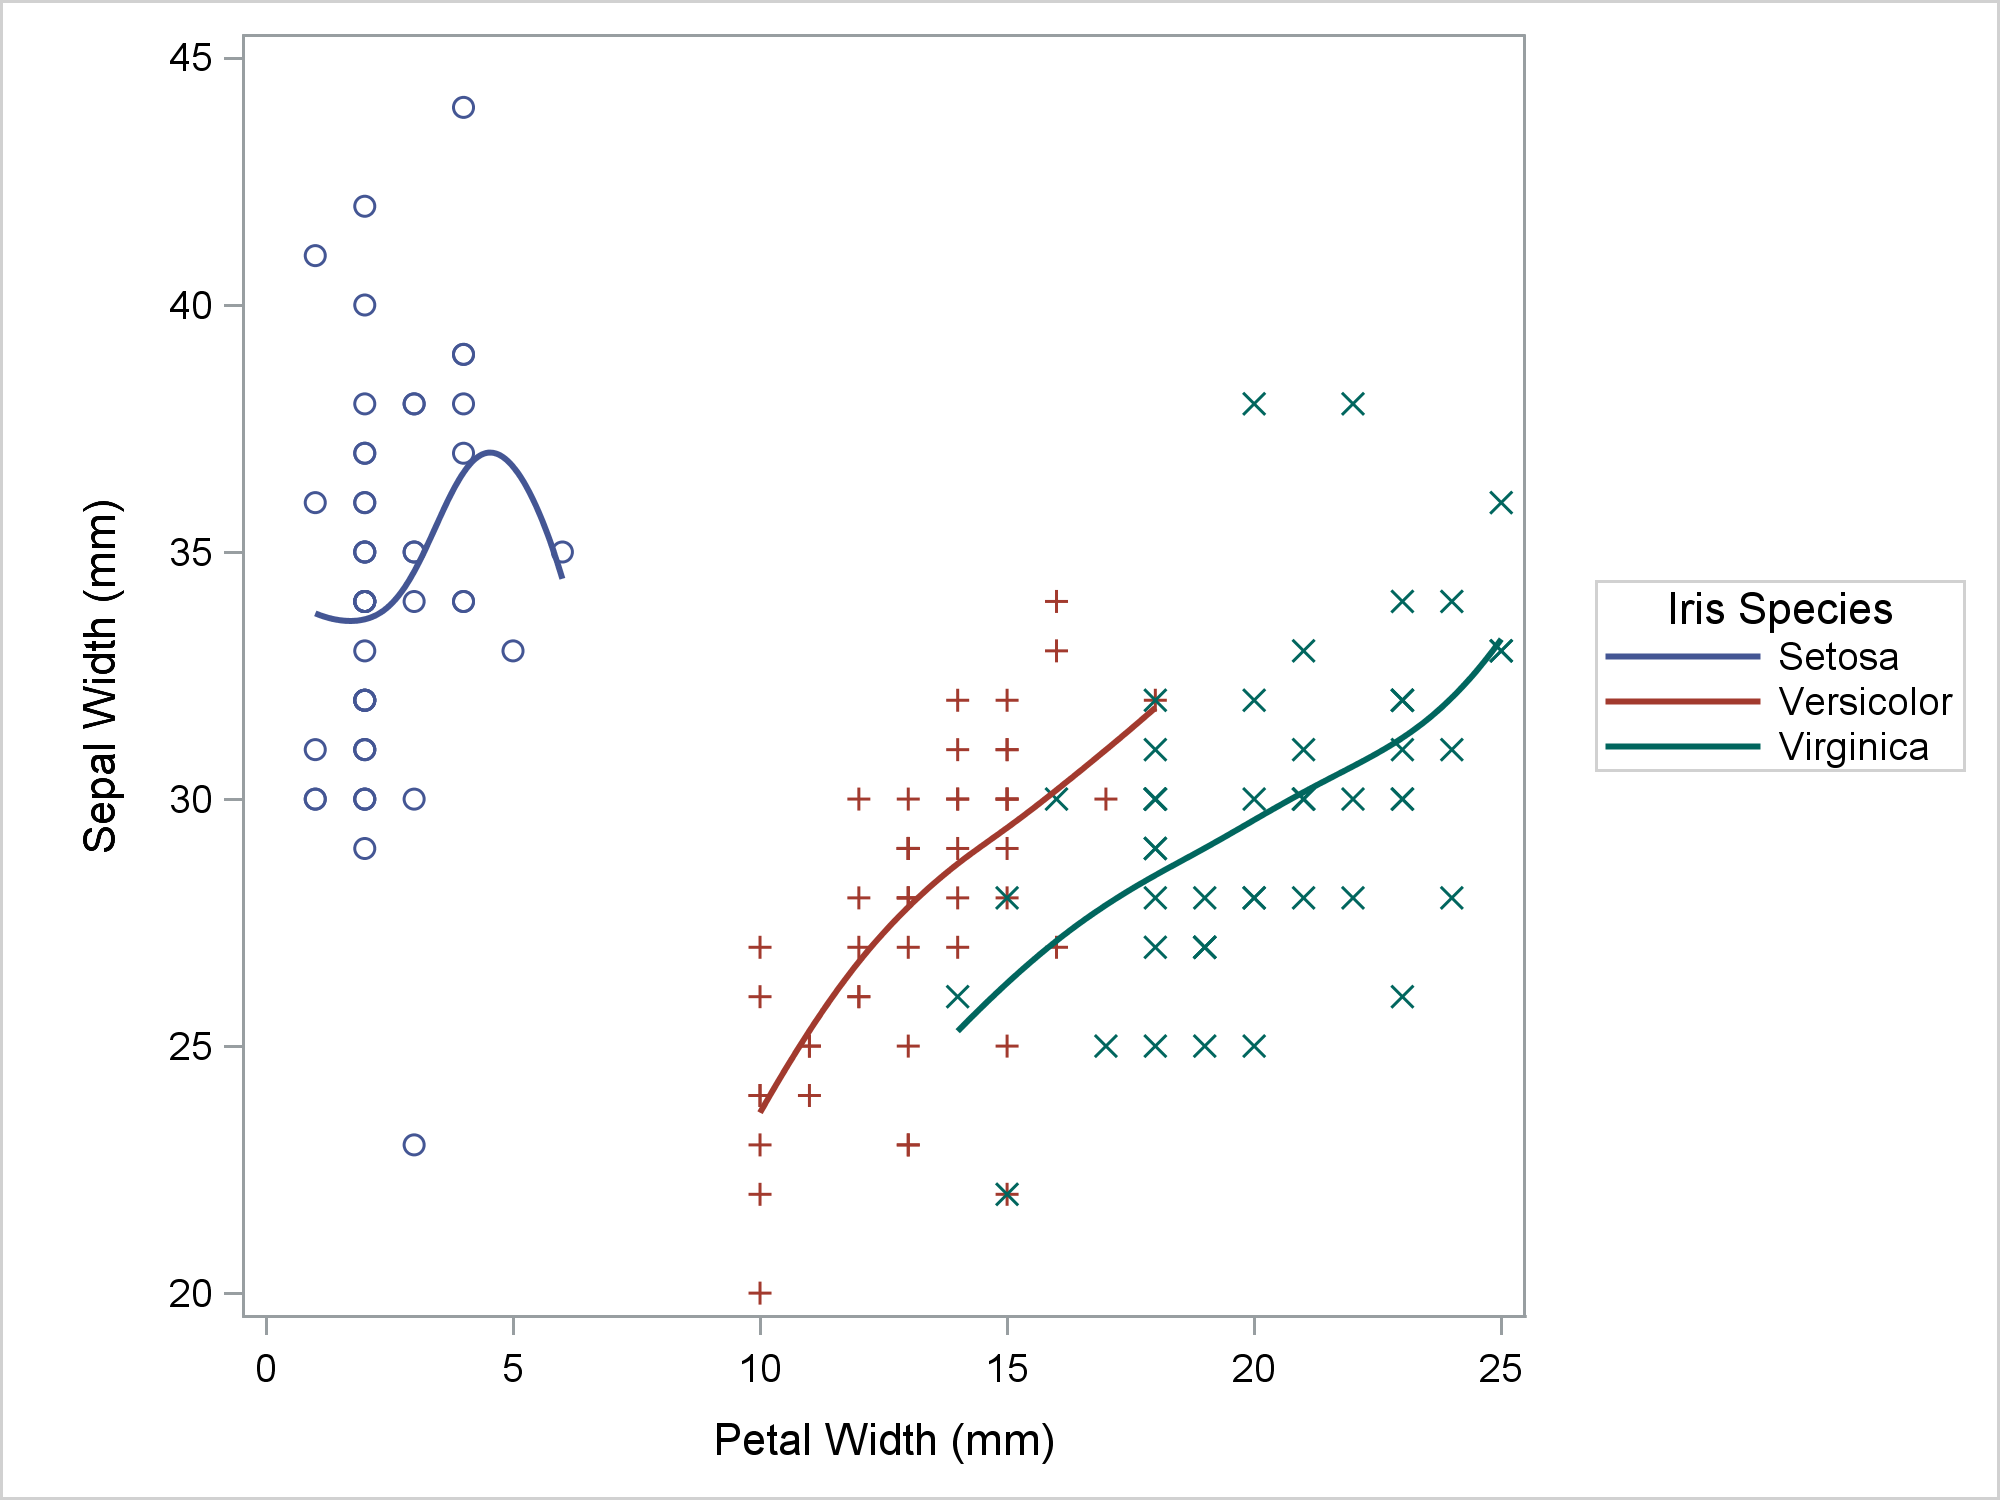
Personally, when I display groups of observations in graphs like fit plots, my favorite approach is to create solid lines but vary the markers and colors.
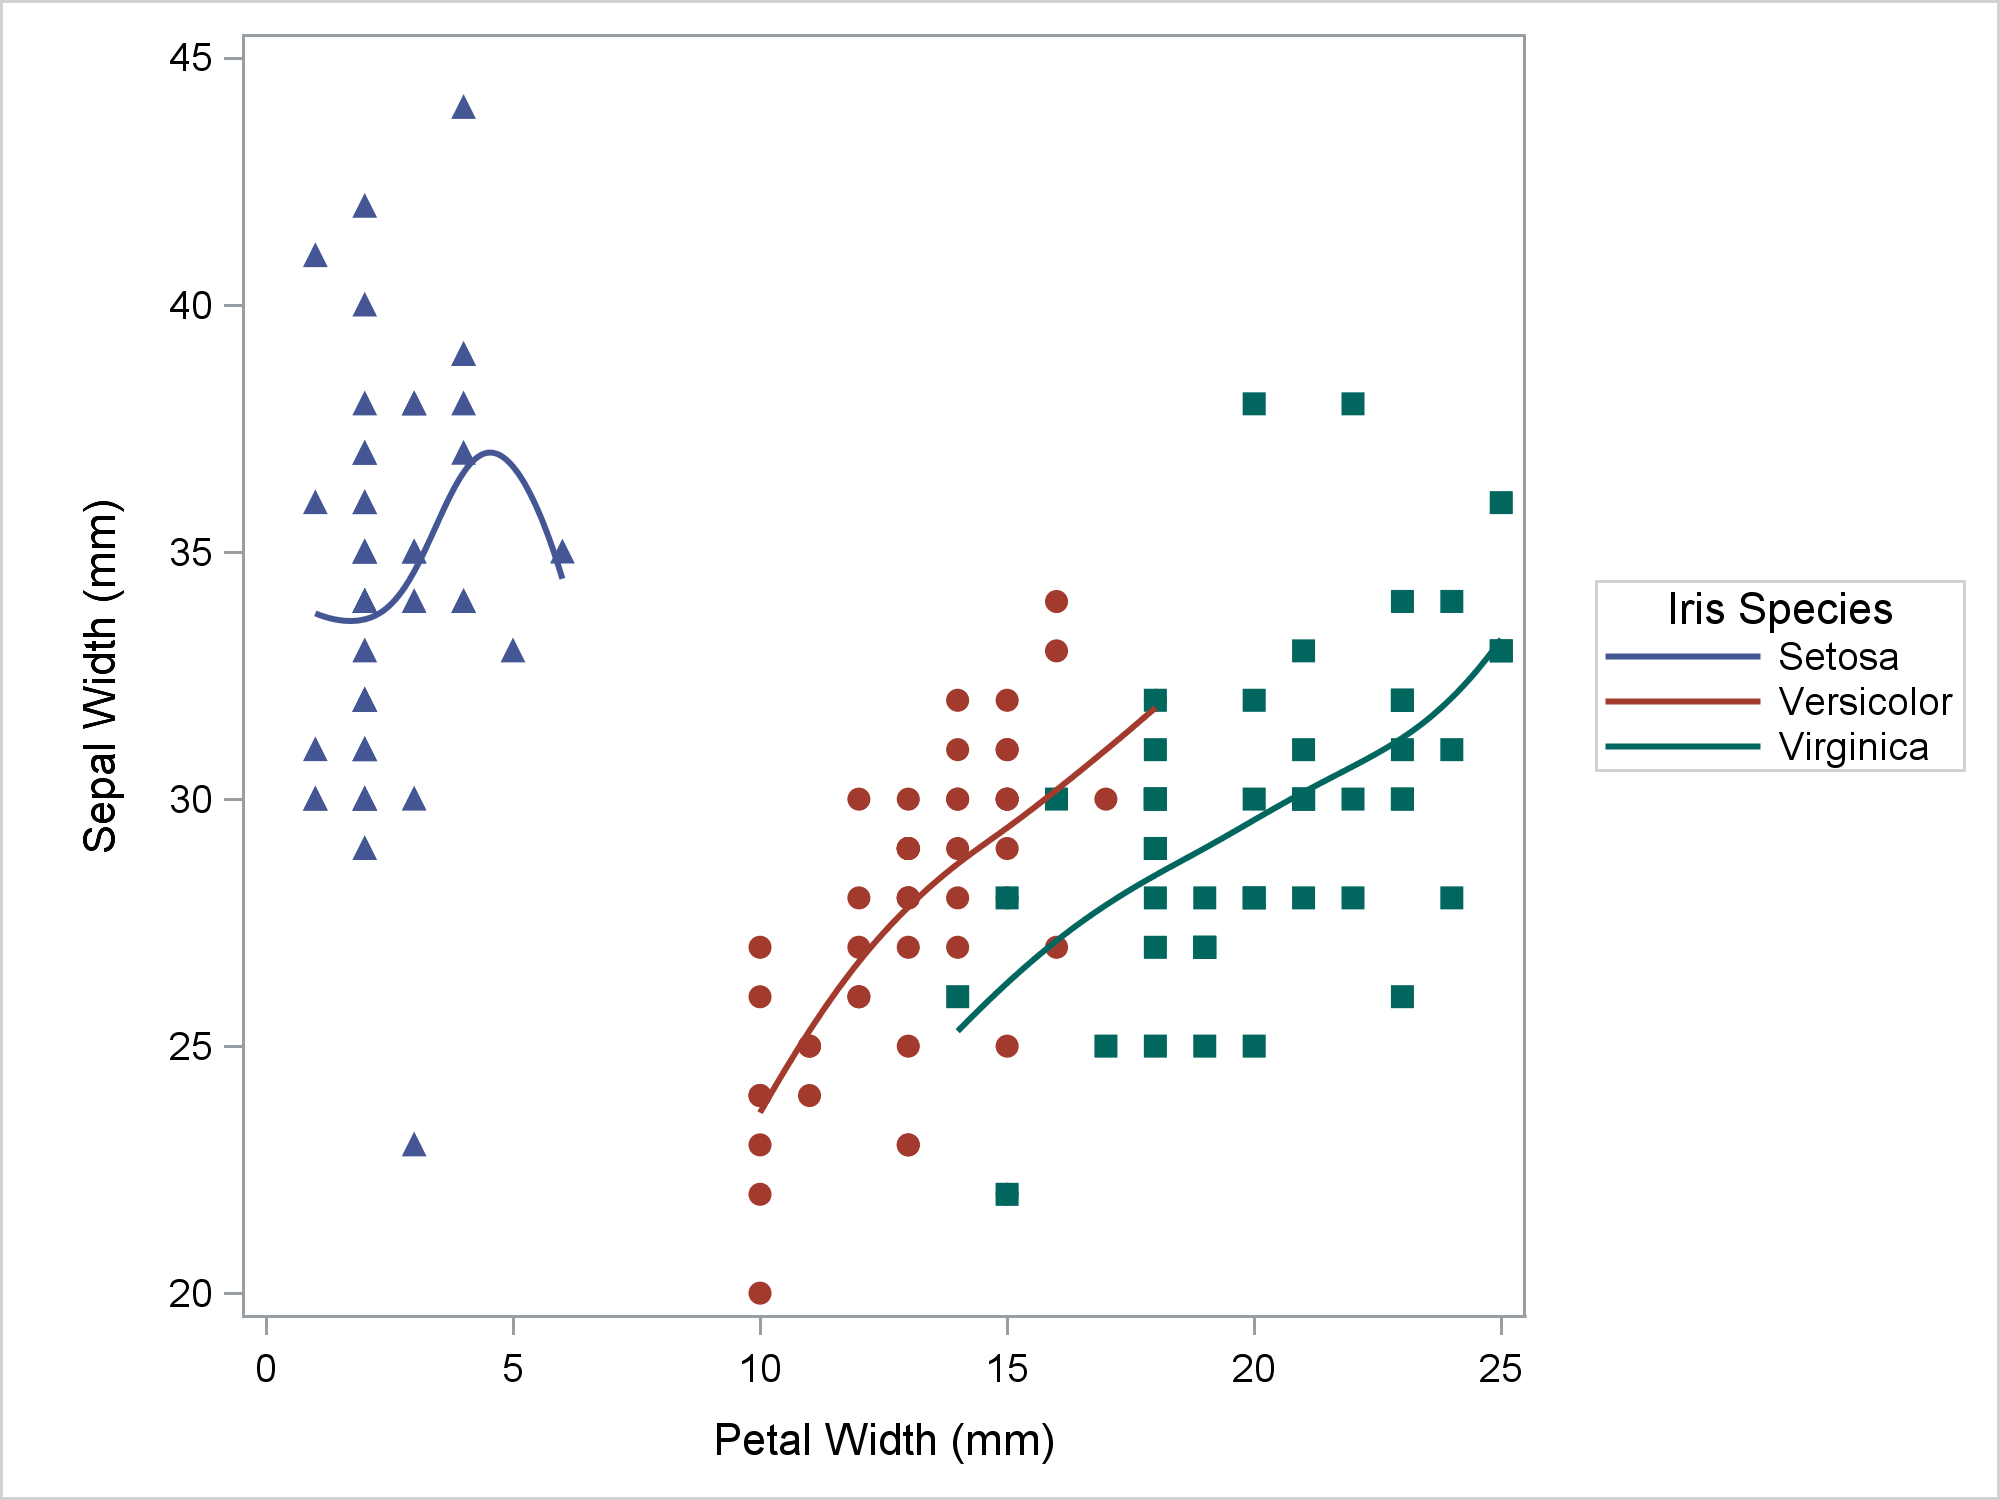
ods graphics on / attrpriority=none; proc sgplot data=sashelp.iris aspect=1; styleattrs datalinepatterns=(solid); pbspline x=petalwidth y=sepalwidth / group=species; keylegend / location=outside position=right across=1; run; |
The following step controls both the markers and the line patterns.
ods graphics on / attrpriority=none;
proc sgplot data=sashelp.iris aspect=1;
   styleattrs datasymbols=(trianglefilled circlefilled squarefilled)
              datalinepatterns=(solid);
   pbspline x=petalwidth y=sepalwidth / group=species;
   keylegend / location=outside position=right across=1;
run; |
When the values in one list are exhausted, ODS Graphics goes back to the beginning of that list.
ods graphics on / attrpriority=none;
proc sgplot data=sashelp.iris aspect=1;
   styleattrs datasymbols=(trianglefilled circlefilled squarefilled)
              datalinepatterns=(solid dot);
   pbspline x=petalwidth y=sepalwidth / group=species;
   keylegend / location=outside position=right across=1;
run; |
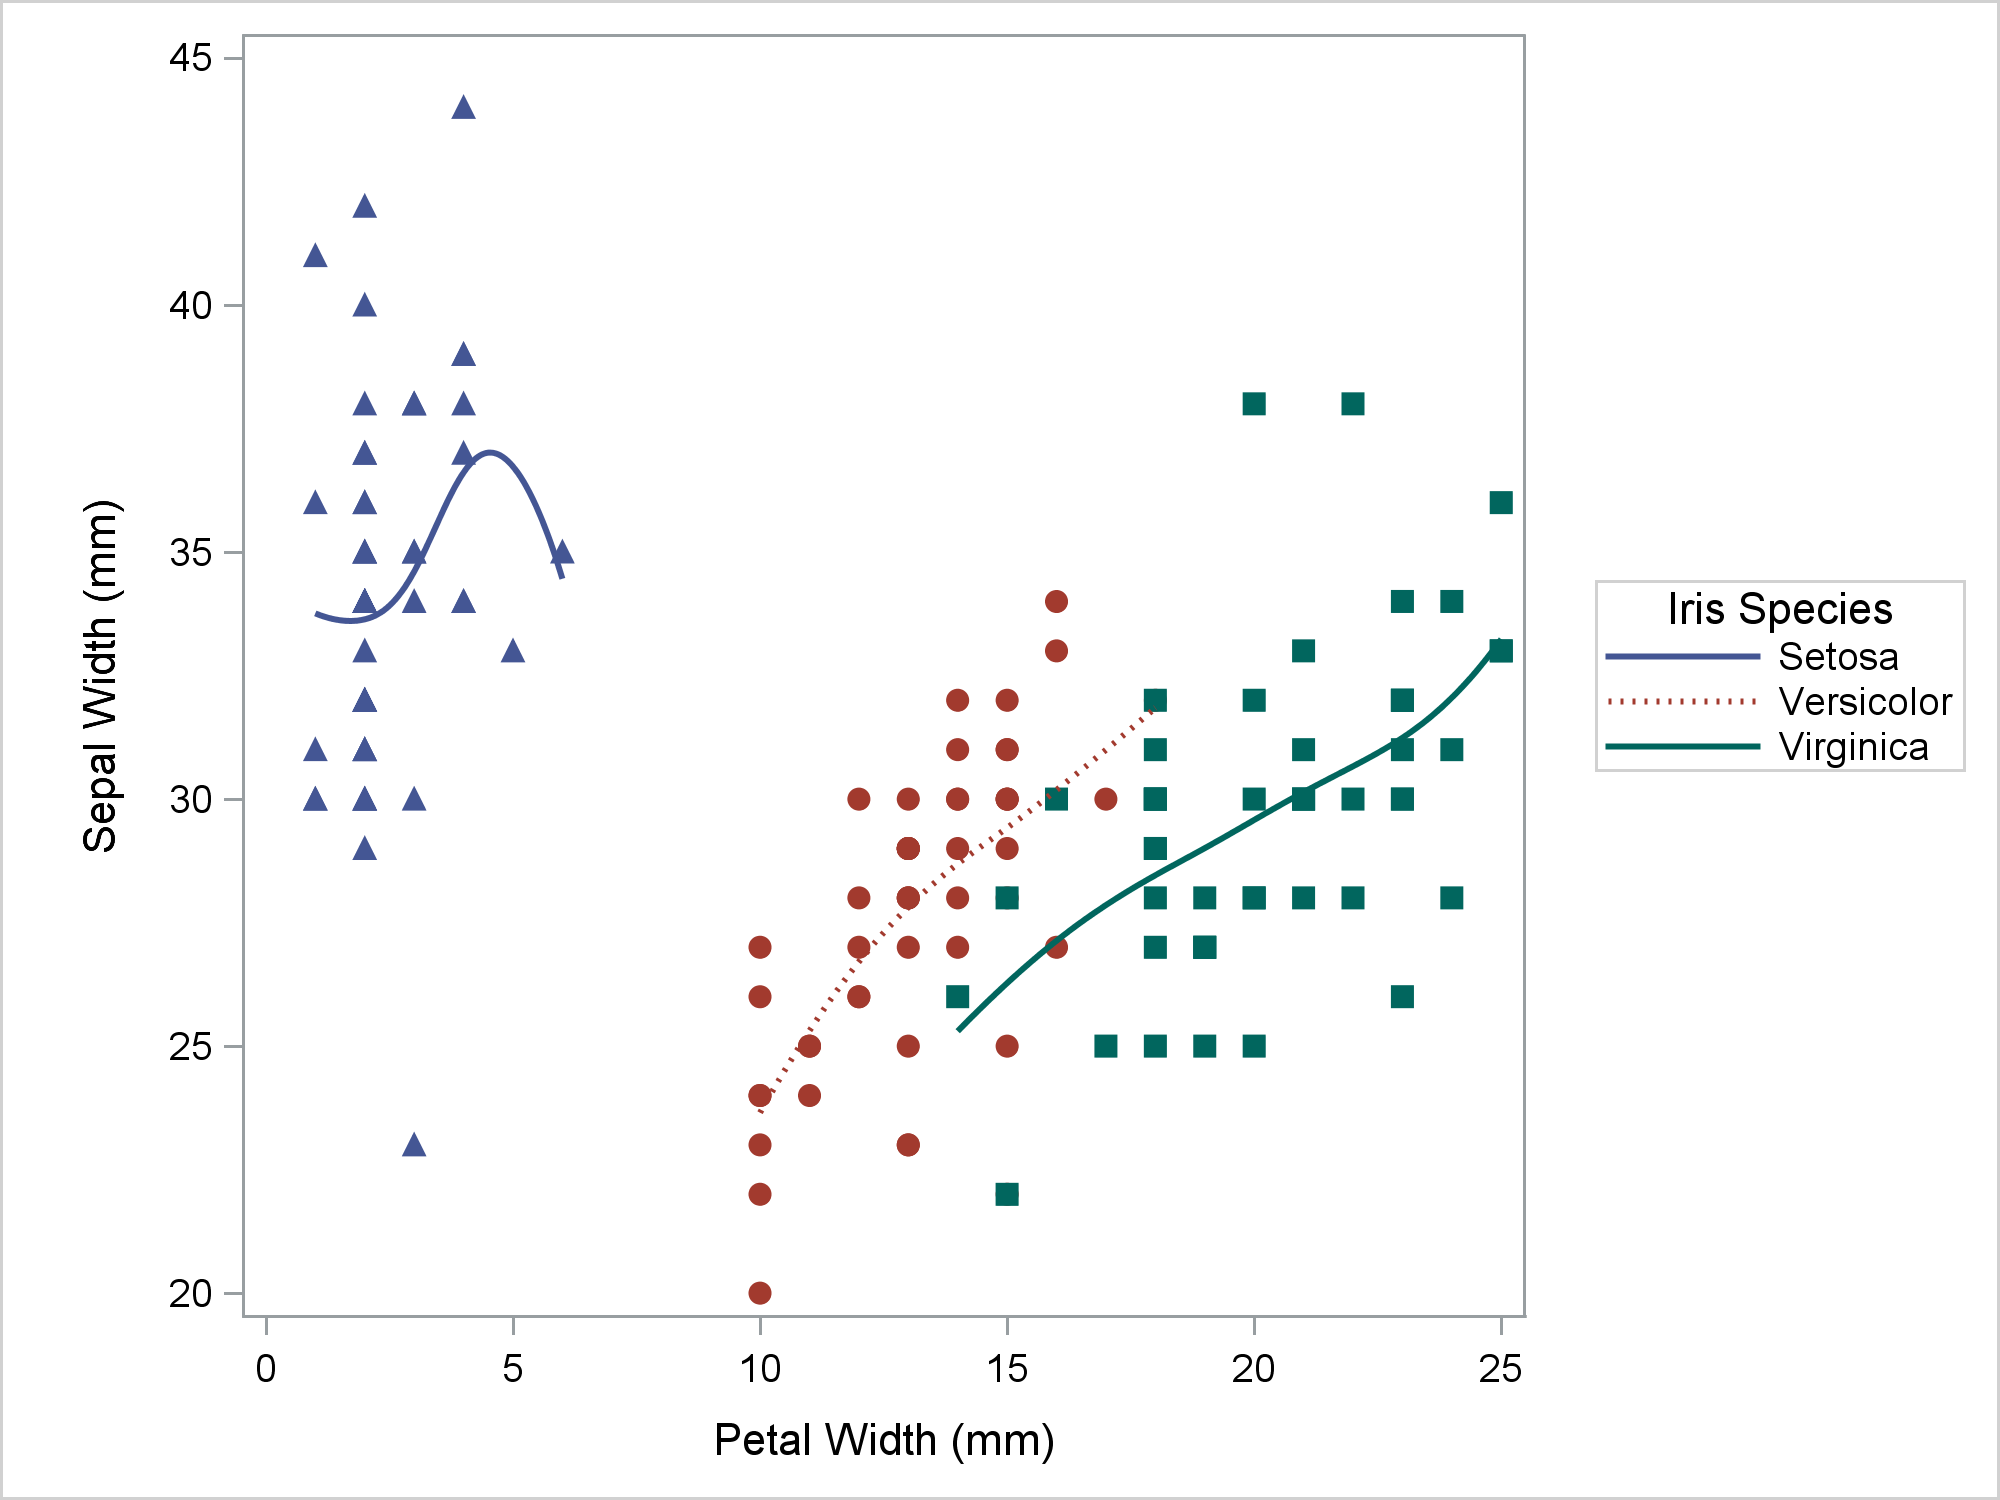
In this graph, the combinations are solid and triangle, dotted and circle, and solid and square (starting at the beginning of the line list after exhausting the line list but before exhausting the symbol list). For more information, see How the Attributes Are Cycled.
The following step displays the HTMLBlue style and its parent styles.
proc template; source styles.htmlblue / expand; run; |
The style elements GraphData1 through GraphData3 are defined as follows.
   class GraphData1 /
      fillpattern = "L1"
      markersymbol = "circle"
      linestyle = 1
      contrastcolor = GraphColors('gcdata1')
      color = GraphColors('gdata1');
   class GraphData2 /
      fillpattern = "X1"
      markersymbol = "plus"
      linestyle = 4
      contrastcolor = GraphColors('gcdata2')
      color = GraphColors('gdata2');
   class GraphData3 /
      fillpattern = "R1"
      markersymbol = "X"
      linestyle = 8
      contrastcolor = GraphColors('gcdata3')
color = GraphColors('gdata3'); |
These options, along with GraphData4 through GraphData12, define the appearance of groups. These style elements show you the default fill patterns, marker symbols, line styles, contrast colors, and colors for groups. The attribute priority does not change the GraphDatai style elements, but it does change how they are accessed. When the attribute priority is color, all attributes including the noncolor attributes are still used, but all of the colors are exhausted before ODS Graphics cycles to the next marker and line. The graphs in Figure 21.53: Markers, Lines, and Colors with Groups in the DEFAULT Style through Figure 21.63: Markers, Lines, and Colors with Groups in the SAPPHIRE Style in the ODS Style Comparisons section of the Statistical Graphics Using ODS chapter in SAS/STAT documentation illustrate. For a small number of groups, which is probably the most typical use case, the noncolor attributes from GraphData2 through GraphData12 are not used when the attribute priority is color.
I want to emphasize that the STYLEATTRS statement overrides the GraphDatai style elements. It does not force them to be used. Overriding those definitions only changes the graph if one or more of these style elements are actually used.
Can you guess what the effects are of the DATASYMBOLS= and DATALINEPATTERNS= options in the next step?
ods graphics on / attrpriority=none;
proc sgplot data=sashelp.iris(where=(species=:'Ve')) aspect=1;
   styleattrs datasymbols=(trianglefilled)
              datalinepatterns=(dash solid shortdash);
   reg      x=petalwidth y=sepalwidth;
   pbspline x=petalwidth y=sepalwidth / nomarkers;
   loess    x=petalwidth y=sepalwidth / nomarkers;
   keylegend / location=outside position=right across=1;
run; |

The three fit plots are displayed using GraphData1 through GraphData3, so the line patterns are DASH, SOLID, and SHORTDASH as specified. The markers are displayed using the GraphDataDefault style element. The option DATASYMBOLS=(TRIANGLEFILLED) overrides the marker symbol in the GraphData1 style element, but it does not affect the graph, because that style element is not used for any markers.
When the GraphDatai style elements are not used, you can use options such as MARKERATTRS= and LINEATTRS= in the plotting statements to control how markers and lines are displayed.
Notice that this next step changes the attribute priority back to color. For this reason, only the filled triangle appears in the graph (not shown).
ods graphics on / attrpriority=color; proc sgplot data=sashelp.iris aspect=1; styleattrs datasymbols=(trianglefilled circlefilled squarefilled); scatter x=petalwidth y=sepalwidth / group=species; keylegend / location=outside position=right across=1; run; |
This is explained in the SAS log by the following message.
NOTE: This graph has ATTRPRIORITY=COLOR in effect. The cycling of your custom
      symbols and/or line patterns is based on color priority. Please see ODS
Graphics documentation on ATTRPRIORITY= option. |
A color priority cycles through colors before it cycles through markers and lines. There is nothing wrong with this specification. PROC SGPLOT prints the note because you might sometimes forget to pair ATTRPRIORITY=NONE with the STYLEATTRS statement. However, that pairing is not required. ATTRPRIORITY=COLOR cycling of attributes along with the STYLEATTRS statement is perfectly legitimate (but noteworthy!).
The STYLEATTRS statement was a most welcome addition to ODS Graphics. Since its debut, we have discussed it extensively in Graphically Speaking and in other blogs. You cannot discuss style attributes without also discussing attribute priority. I have deliberately said as little as I thought I could about attribute cycling to keep at least the first part of this post at the getting-started level. For more about style attributes, attribute priority, attribute cycling, and their interactions, see Rick Wicklin's post on this topic.


1 Comment
Pingback: PUSH, POP, and reset options for ODS graphics - The DO Loop