If you use PROC SGPLOT to create ODS graphics, "ATTRS" are everywhere. ATTRS is an abbreviation of "attributes." Most options that change the attributes of a graphical element end with the ATTRS suffix. For example, the MARKERATTRS option modifies attributes of markers, the LINEATTRS option modifies attributes of lines, and the FILLATTRS option modifies attributes of the filled area of a bar or other region. These options are easy to remember and use.
However, there are three "ATTRS" that you might find more confusing: CYCLEATTRS, ATTRPRIORITY, and STYLEATTRS. These options determine the colors, line patterns, and marker symbols that are used to represent groups in your data. They interact with each other when you use a GROUP= option to specify groups and also use multiple statements to overlay several graph types such as scatter plots and series plots.
This article summarizes the ATTRPRIORITY, CYCLEATTRS, and STYLEATTRS keywords and provides an example that shows how they interact with each other. The end of this article presents a list of references for further reading.
What are ATTRPRIORITY, CYCLEATTRS, and STYLEATTRS?
In PROC SGPLOT, many statements support the GROUP= option. In order to distinguish one group from another, the groups are assigned different attributes such as colors, line patterns, marker symbols, and so on. The colors, patterns, and other attributes are defined by the current ODS style (or by the STYLEATTRS statement or the DATTRMAP= data set), but the ATTRPRIORITY and CYCLEATTRS keywords determine how the colors, patterns, and symbols combine for each group. The following describes the syntax and purpose of each keyword:
- The ATTRPRIORITY option is specified on the ODS GRAPHICS statement. If you specify ATTRPRIORITY=COLOR, then groups are represented by changing the color of markers and lines, but not line patterns or marker symbols. If you specify ATTRPRIORITY=NONE, groups are represented by changing the color, line patterns, and marker symbols for each group. The ATTRPRIORITY=NONE is essential for "no color" styles such as the Journal style.
- The CYCLEATTRS (or NOCYCLEATTERS) option affect whether attributes change when you overlay multiple graphs by using two or more statements. Notice that the word "CYCLE" begins with an "S" sound, as does the word "statements." Say the following sentence out loud, emphasizing the common "S" sounds: "CYCLEATTRS affect Statements."
- The STYLEATTRS statement in PROC SGPLOT overrides the colors, patterns, and symbols in the current style. You can use the STYLEATTRS statement to set the combination of attributes that appear for each group.
Before looking at the interaction between these keywords, recall how the ATTRPRIORITY= option affects a graph that has only one statement. The following calls to PROC SGPLOT are identical. The only difference is the ATTRPRIORITY= option.
title "Iris Data: AttrPriority=Color"; ods graphics / AttrPriority=Color; proc sgplot data=Sashelp.Iris; reg x=PetalWidth y=SepalLength / group=Species markerattrs=(size=10) lineattrs=(thickness=4); run; title "Iris Data: AttrPriority=None"; ods graphics / AttrPriority=None; proc sgplot data=Sashelp.Iris; reg x=PetalWidth y=SepalLength / group=Species markerattrs=(size=10) lineattrs=(thickness=4); run; |
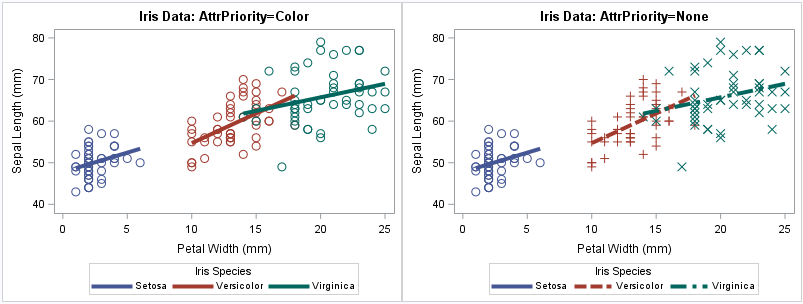
The plot on the left shows the result of using ATTRPRIORITY=COLOR with the HtmlBlue style. The three groups are represented by using the first three colors in the style (in this case, blue, red, and green), but the line patterns and marker symbols do not change between groups. In contrast, the plot on the left is the result of using ATTRPRIORITY=NONE. The three groups are represented by using the first three colors in the style and also the first three line patterns (solid, dashed, and dash-dot) and the first three marker symbols (circle, plus sign, and "X"). The results might depend on the current ODS style.
The interaction between ATTRPRIORITY and CYCLEATTRS
The ATTRPRIORITY and CYCLEATTRS options interact when you use two or more statements to overlay graphs. In Warren Kuhfeld's short course on "Advanced ODS Graphics Examples in SAS," he presents a slide that shows how these options interact. The following example creates a panel of graphs that is inspired by Warren's slide. Each graph in the example shows the same data (the closing stock price for two companies in 2001–2003) displayed for each of the four combinations of the ATTRPRIORITY and CYCLEATTRS options. Although the LOESS statement can display the markers, I used a separate SCATTER statement because I want to illustrate how the CYCLEATTRS statement affects the attributes.
data Stocks; set Sashelp.Stocks; where '01JAN2001'd <= Date <= '31OCT2003'd and Stock in ("IBM", "Microsoft"); run; /* The code for each call is the same except for the options. Wrap in a macro for brevity. */ %macro GraphIt(priority, cycle); title "AttrPriority=&priority.; &cycle."; ods graphics / AttrPriority=&priority.; proc sgplot data=Stocks &cycle.; loess x=Date y=Close / group=Stock lineattrs=(thickness=4) NoMarkers smooth=0.75; scatter x=Date y=Close / group=Stock markerattrs=(size=10); yaxis label="Stock Price"; run; %mend; ods graphics / width=400px height=300px; ods layout gridded columns=2 advance=table column_gutter=0 row_gutter=0; %GraphIt(Color, NoCycleAttrs); %GraphIt(None, NoCycleAttrs); %GraphIt(Color, CycleAttrs); %GraphIt(None, CycleAttrs); ods layout end; |
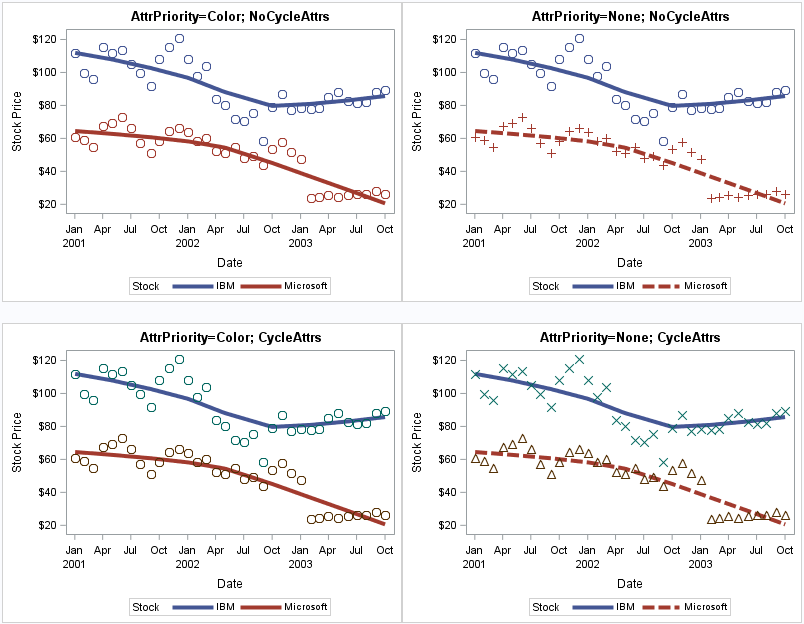
The panel for the example shows the interaction between the ATTRPRIORITY= and CYCLEATTRS options.
- The top-left graph shows the graph for ATTRPRIORITY=COLOR and NOCYCLEATTRS. Only colors are used to distinguish the groups (IBM and Microsoft). The second statement (SCATTER) uses the same attributes as the first statement (LOESS).
- The top-right graph shows the graph for ATTRPRIORITY=NONE and NOCYCLEATTRS. Colors, line patterns, and symbols are used to distinguish the groups. The second statement (SCATTER) uses the same attributes as the first statement (LOESS).
- The bottom-left graph shows the graph for ATTRPRIORITY=COLOR and CYCLEATTRS. Only colors are used to distinguish the groups (IBM and Microsoft). The first statement (LOESS) uses the first two colors in the style (blue and red) and the second statement (SCATTER) uses the third and fourth colors in the style (green and brown). Because the markers are not filled, it might be difficult to see that the marker colors are green and brown, but you can click on the graph to enlarge it.
- The bottom-right graph shows the graph for ATTRPRIORITY=NONE and CYCLEATTRS. Colors, line patterns, and symbols are used to distinguish the groups. The first statement (LOESS) uses the first two attributes in the style (blue-solid and red-dashed) whereas the second statement (SCATTER) uses the third and fourth attributes (green-X and brown-triangle).
Depending on your needs, either graph in the first row would be appropriate for color graphs. The lower-right plot is most suitable for ODS styles that create monochrome graphs.
The STYLEATTRS statement
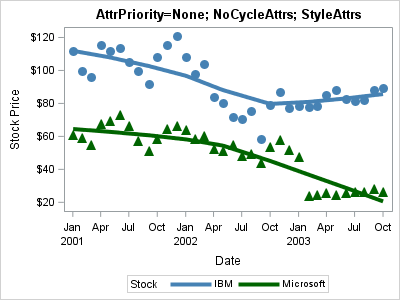
After you understand the interaction between the ATTRPRIORITY= and CYCLEATTRS options, it is straightforward to use the STYLEATTRS statement. The statement merely overrides the group attributes for the current style. If you specify fewer attributes than the number of groups, the attributes are cyclically reused. For example, the following STYLEATTRS statement specifies that all lines should be solid but specifies different colors and symbols for the groups. Because two attributes are specified, the second statement reuses the same colors and symbols even though the NOCYCLEATTRS option is set:
title "AttrPriority=None; NoCycleAttrs; StyleAttrs"; ods graphics / AttrPriority=None; proc sgplot data=Stocks NoCycleAttrs; styleattrs datalinepatterns=(solid) datacontrastcolors=(SteelBlue DarkGreen) datasymbols=(CircleFilled TriangleFilled); loess x=Date y=Close / group=Stock lineattrs=(thickness=4) NoMarkers smooth=0.75; scatter x=Date y=Close / group=Stock markerattrs=(size=10); yaxis label="Stock Price"; run; |
Reset the default attribute priority
Here's another trick I learned from Warren's course: You can use the RESET= option to reset the default value of the ATTRPRIORITY option for the current style:
ods graphics / reset=attrpriority; /* reset the default value for the current style */ |
Summary and further reading
This article provides an example and summarizes the behavior of the ATTRPRIORITY= option (on the ODS GRAPHICS statement) and the CYCLEATTRS option (on the PROC SGPLOT statement). These options interact when you have several statements in PROC SGPLOT that each use the GROUP= option. You can use the STYLEATTRS statement to override the default attributes for the current ODS style.
Much more can be said about these options and how they interact. In addition to the documentation links in the article, I recommend the following:
- Kuhfeld's free e-book Basic ODS Graphics Examples is helpful for any novice user of ODS graphics and the Graph Template Language (GTL). The ATTRPRIORITY= option is discussed on pp. 17-20.
- Sanjay's article "Attributes Priority for the Inquiring Mind" is a nice introduction to the ATTRPRIORITY= option and how ODS combines various attributes to represent groups.
- Sanjay's article "Setting Group Colors is Easier with SAS 9.4" describes the STYLEATTRS statement and how it interacts with the ATTRPRIORITY= option.
- Chapter 21, “Statistical Graphics Using ODS” in the SAS/STAT User’s Guide has a lot of useful information about the ODS styles and the statistical graphs that are produced by SAS/STAT procedures. For more information about styles and sttributes, see the section "ODS Styles."

8 Comments
Thank you, thank you. This is an excellent post. I had no idea about AttrPriority=Color. Just yesterday I was working on a bunch of quick plots which should use color only to distinguish groups, but since I was being lazy I didn't bother to force the line styles and symbols to be the same. Looks like all I'll need to do is set that one option to get the graphs I want. Glad I started my day by reading your blog!
Thanks for the plug and the kind words, Rick! Thanks too for helping getting the word out about attribute priority, attribute cycling, and the other attrs. They are important topics that trip up a lot of people when they are first starting out with ODS Graphics.
Rick mentions my course. What he does not say is I had pneumonia before this year's Global Forum and could not go. Rick graciously agreed to give my tutorial. While Rick is clearly an expert on ODS Graphics, he was not familiar with the entire two-hour presentation. He had Wednesday evening through Friday to learn and rehearse a lot of material, some of which was new to him. I know from his rehearsal that he did an excellent job at Global Forum. I am happy to have this public forum to thank Rick for covering for me while I was sick. Thank you so much, Rick!
Thanks, Rick for this useful summary of these features. Often, users will wonder why their plots do not display the marker symbols that they have defined in the STYLEATTRS statement. This is usually because the HTMLBlue style is in effect (ATTRPRIORITY=COLOR), which delays the use of the symbols. By default, HTMLBlue is one of the few styles that uses ATTRPRIORITY=COLOR. (Pearl and Sapphire are others.) Most SAS shipped styles have ATTRPRIORITY=none. This can be changed in the style itself, or on the ODS GRAPHICS statement or in BEGINGRAPH GTL statement.
Very nice article Rick.
I actually said "CYCLEATTRS affect Statements" out loud a few times. Hope it catches on.
Also, kudos for taking over Warren's presentation with such short notice!
Pingback: How to fix common problems in output from ODS Graphics procedures - SAS Users
This was an absolutely necessary blog/macro for me! For some reason, I'm always running through every possible combination when things don't work (seems like more than 4 when you're frustrated). Saving!
Yes, I agree. Understanding how things work saves me time in the long run, which is why I blog about them.
Pingback: The CYCLEATTRS option in PROC SGPLOT - The DO Loop