
The best AI assistance meets you where you are.
A chat window opens. A question surfaces. An answer comes back before momentum fades. That conversational experience is powerful precisely because it keeps insight close to the work. But there's a version of assistance that goes even further – one that doesn't wait to be asked.
In the third blog post in this series, we explored how SAS® Viya® Copilot introduces a conversational AI assistant into SAS® Visual Analytics to help users explore data, create reports, and surface insights through natural language. The chat experience is powerful precisely because it keeps users inside the analytical environment while questions surface and evolve.
But conversation and embedded assistance are two different things.
If the chat interface puts SAS Viya Copilot alongside your work, the capabilities we’re exploring now put it inside the work itself. No chat pane. No context switch. Assistance that surfaces at the moment a task begins and stays out of the way the rest of the time.
View every blog in this series about SAS Viya CopilotThe hidden costs of routine tasks
In the second blog post in this series, we identified the execution gap: the space between having analytical capability and actually sustaining the momentum to act on it. A large share of that gap isn’t caused by complex problems. It’s caused by repetitive ones:
- Preparing data for effective insights.
- Interpreting what a visualization is showing.
- Translating reports for global audiences.
These tasks often require manual effort, domain knowledge, or additional context switching that slows users down. Viya Copilot’s in-context capabilities are designed to address exactly this. Not by removing users from the workflow, but by surfacing GenAI assistance directly within the interface where the work is already happening.
Grouping without the grind
Creating custom categories is a common part of preparing data for analysis. Users often need to organize raw values into higher-level, more meaningful groupings:
- Cities into geographic regions.
- Products into brands or product families.
- Departments into business units.
Traditionally, this process requires users to manually create groups and assign values one by one – a task that can become time-consuming when working with large or unfamiliar datasets.
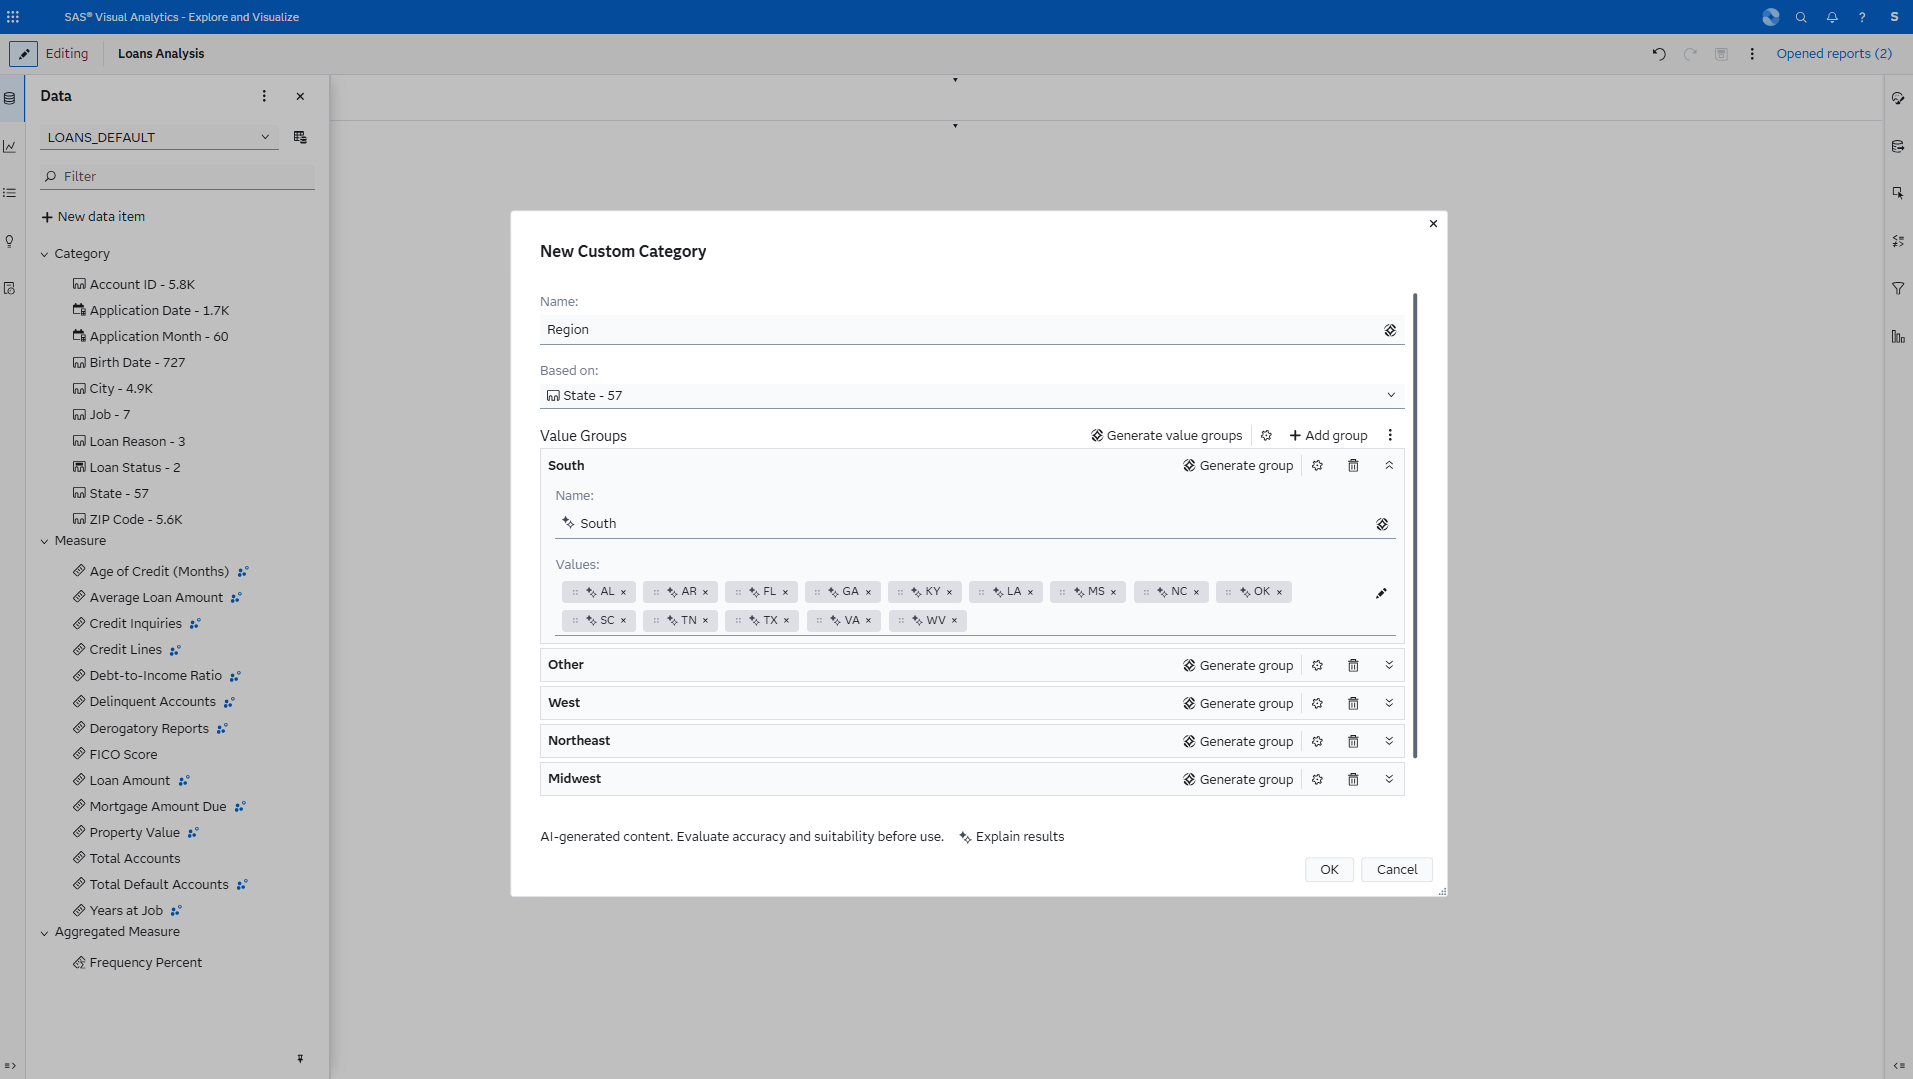
With SAS Viya Copilot, users can generate these value groups automatically using generative AI directly within the custom category workflow.
For example, a user working with a list of cities can ask Copilot to generate geographic regions. Similarly, product names can be grouped into likely brands or categories without requiring manual assignment of every individual value.
The workflow also supports iterative refinement. Users can provide additional context to the value group generation, which can be either instructional ("Create 4 groups") or clarifying ("STATE refers to the current status"), and then regenerate the groupings.
For added transparency, users can view an explanation of what external data Copilot used to generate the value groups.
Summaries that explain the story behind the visual
Charts and visualizations communicate information quickly – but interpreting what really matters within a graph can still take time.
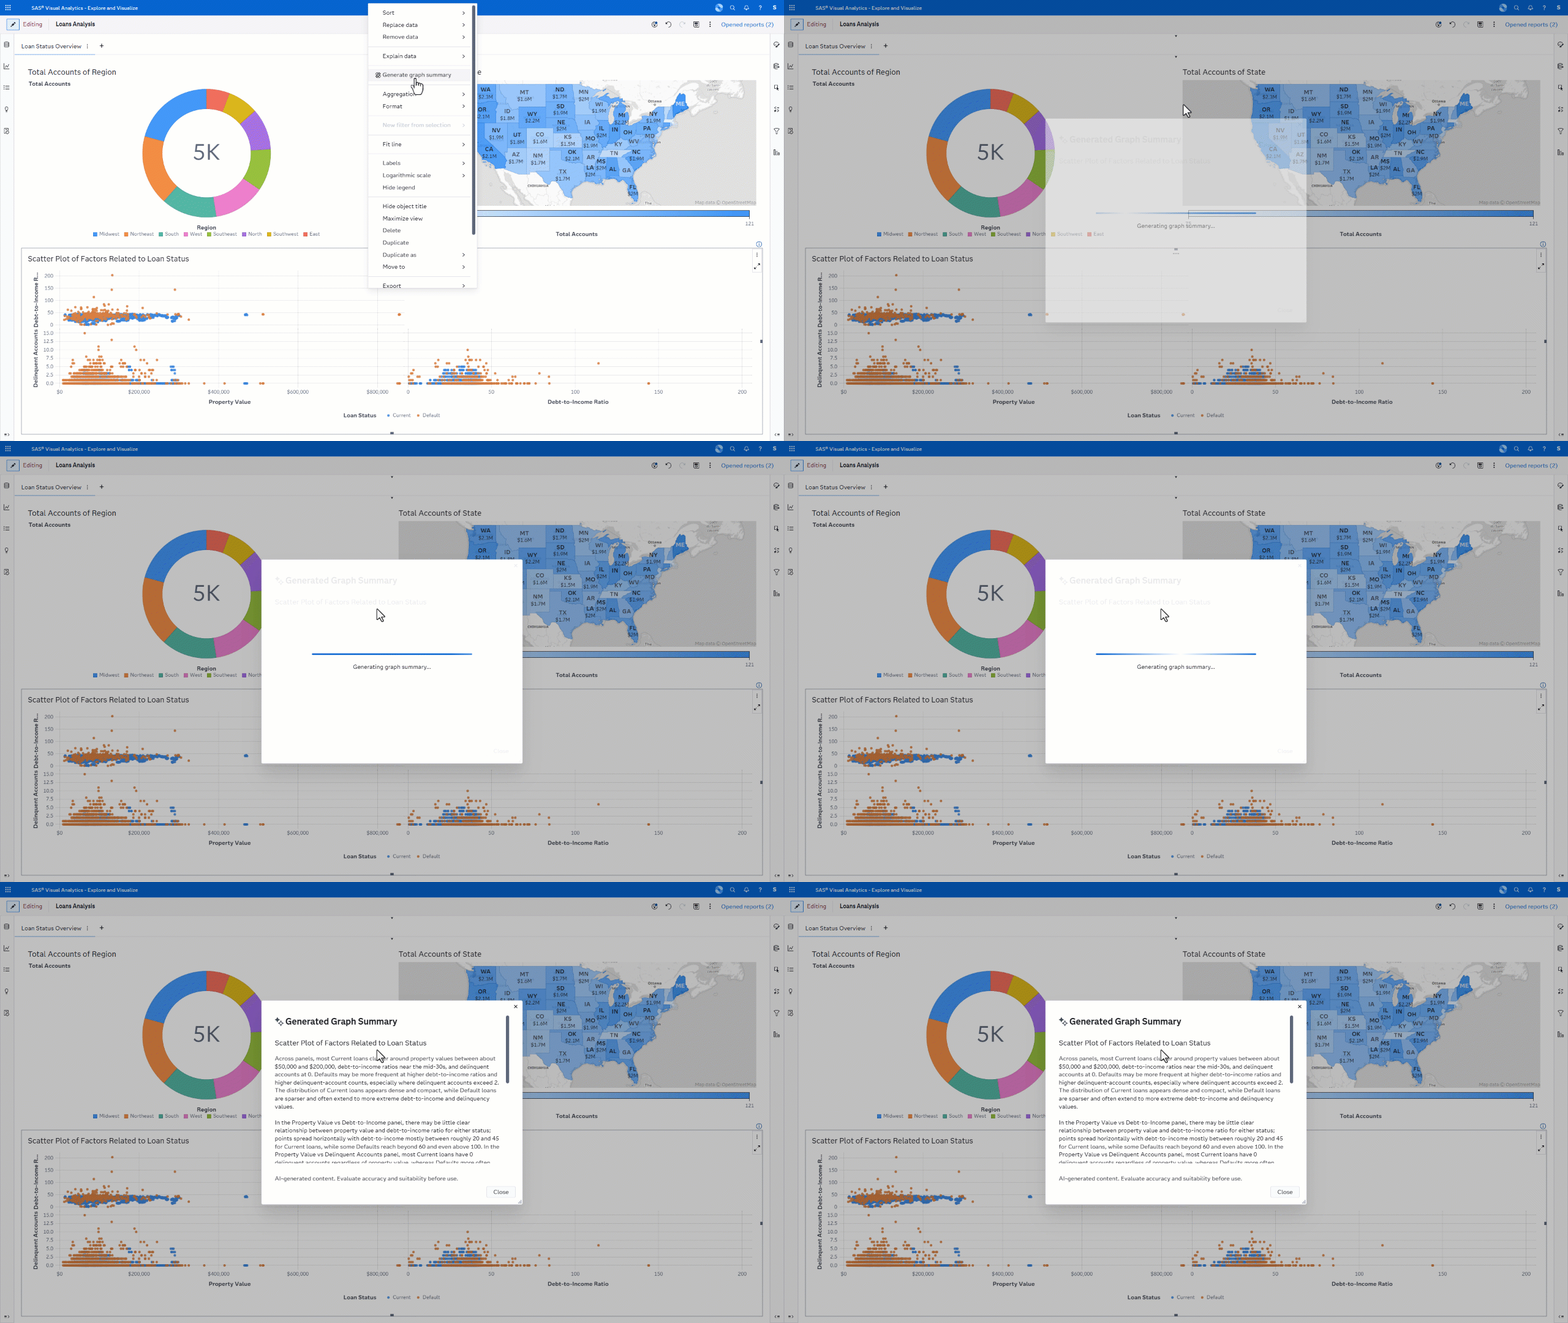
With SAS Viya Copilot, users can generate on-the-fly natural language summaries that are grounded in the data. Copilot analyzes the visual and generates a concise narrative summary that highlights important analytical insights and patterns, including trends, correlations, seasonality and potential outliers.
These summaries can help users interpret findings more quickly – especially when exploring unfamiliar data, reviewing complex dashboards, or preparing executive summaries based on detailed reports.
For example:
- A time series visualization might highlight seasonal trends or unexpected spikes.
- A scatter plot summary could identify strong correlations or notable outliers.
- A bar chart summary may call attention to top-performing categories or unusually large gaps between groups.
This capability is particularly valuable because it aims to reduce the time-to-insight between seeing a chart and understanding its meaning.
Localizing reports for global audiences
In an increasingly global workforce, organizations often need to distribute reports across teams, regions, and countries where users speak different languages. Translating report content manually is often time-consuming – especially when dashboards include many pages, prompts, labels, and visual elements.
SAS Viya Copilot helps streamline this process by embedding AI-assisted report localization directly in SAS Visual Analytics. After a target language is chosen, Copilot generates translated labels for report elements, including page names, chart titles, and other report text content.
Users can then review the generated translations for appropriateness or export the translated text for additional review or collaboration.
Users can also refine the results by specifying additional information or instructions to help guide the generated values. This additional guidance capability is especially useful when working with industry-specific terminology, brand language, or regional phrasing preferences.
SAS Visual Analytics also maintains transparency throughout the experience. Translations generated by AI are clearly marked, allowing users to distinguish AI-generated content from manually created content.

AI that’s integrated into the analytics experience
One of the most important aspects of these embedded capabilities is that they do not feel separate from the application.
This matters because the most effective AI experiences are often the ones that reduce friction and context switching. SAS Viya Copilot enhances existing workflows with targeted assistance exactly where users need it, maximizing productivity.
In the next post in this series, we’ll explore how SAS Viya Copilot combines GenAI assistance with advanced models to help users uncover deeper insights and accelerate analytical decision-making.

1 Comment
I would love to be able to use thing functionality within our company, but we're stuck since the Viya Copilot is not in scope of the SAS Viya SOC 2 Type II audits. Any news on when that changes?