A career in review - my final Graphically Speaking post

After almost 32 years, I am retiring from SAS.

Warren F. Kuhfeld is a distinguished research statistician developer in SAS/STAT R&D. He received his PhD in psychometrics from UNC Chapel Hill in 1985 and joined SAS in 1987. He has used SAS since 1979 and has developed SAS procedures since 1984. Warren wrote the SAS/STAT documentation chapters "Using the Output Delivery System," "Statistical Graphics Using ODS," "ODS Graphics Template Modification," and "Customizing the Kaplan-Meier Survival Plot." He also wrote the free web books Basic ODS Graphics Examples and Advanced ODS Graphics Examples.
After almost 32 years, I am retiring from SAS.
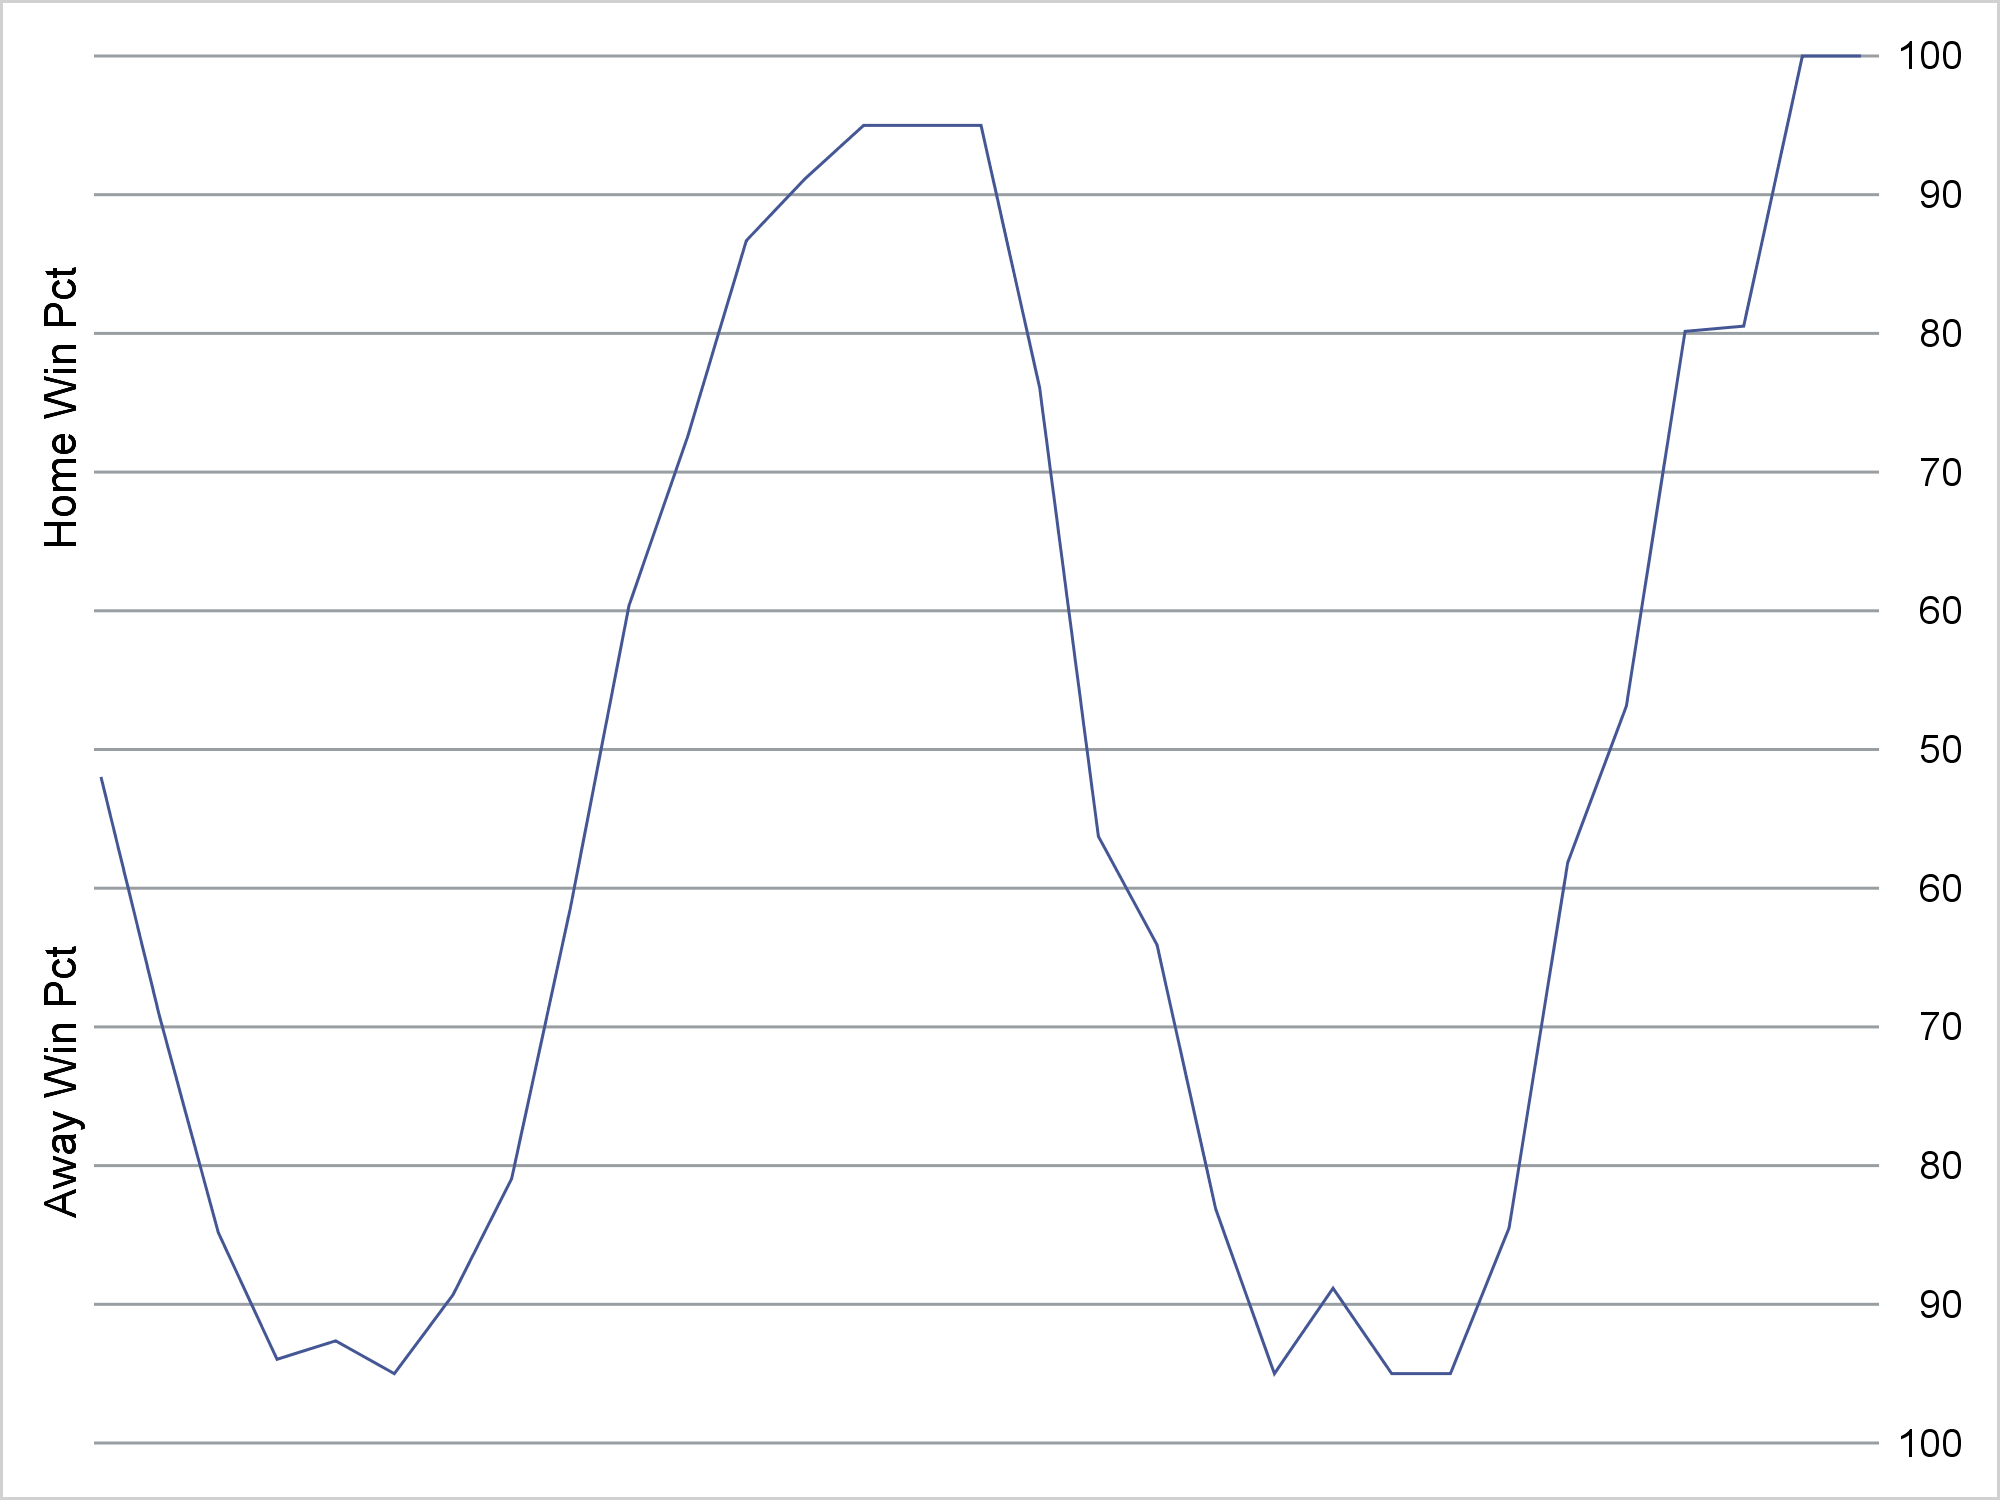
By using a format, you can change the tick values and create values that range from 100 to 50 to 100 to display the probable outcome of a sporting event.

The STYLEATTRS statement in PROC SGPLOT enables you to override colors, markers, line patterns, fill patterns, and axis break patterns in ODS styles, without requiring you to change the ODS style template.