Sometimes you might wish to display only one triangle of a correlation matrix. If you search the web for 'SAS triangle correlation' you will find some ad hoc solutions. This post shows more general solutions that rely on the ODS document, table templates, and the FILE PRINT ODS= statement in the DATA step. Of course, you can also use a graph. The following step displays a correlation matrix and outputs it to an ODS output data set.
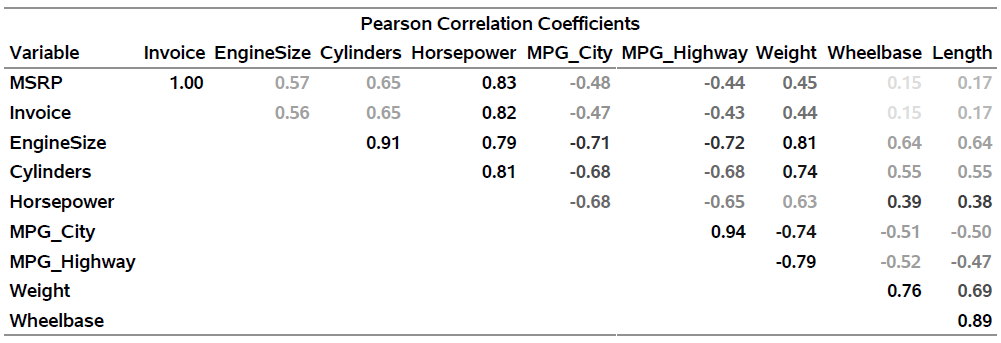
proc corr data=sashelp.cars; ods output PearsonCorr=p; run; |
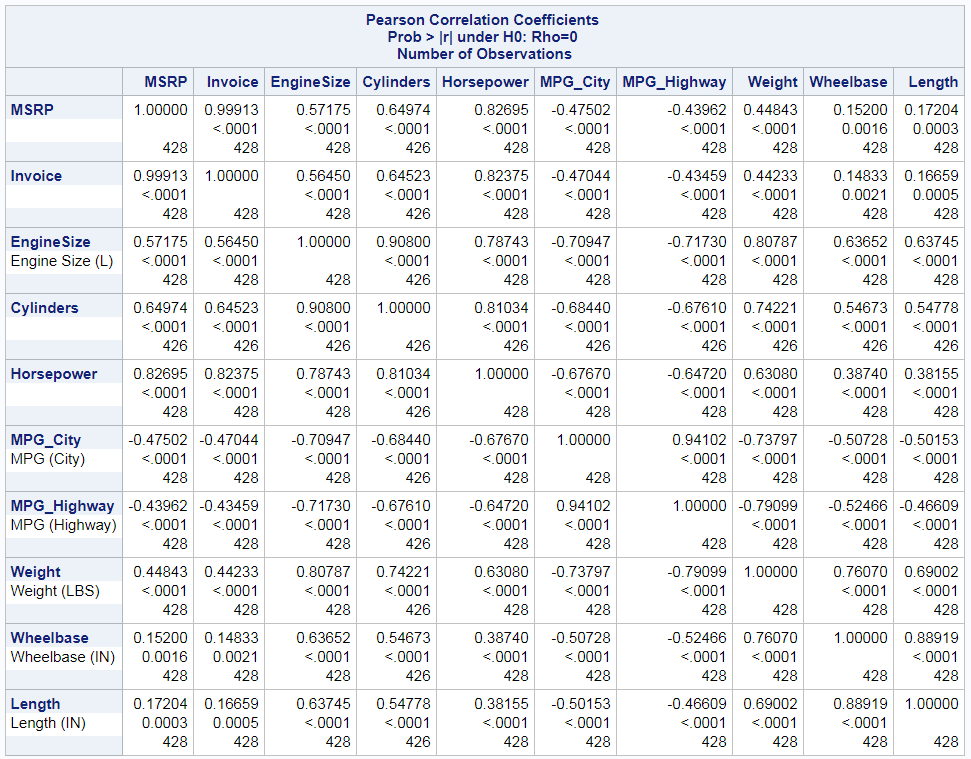
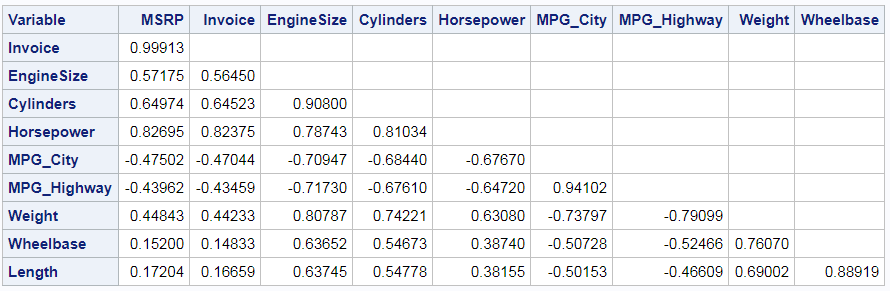
This is the output that comes directly from PROC CORR. It displays a stacked matrix consisting of the correlations, p-values, and the ns for each correlation. The first column contains variable names and labels. The column headers contain variable names.
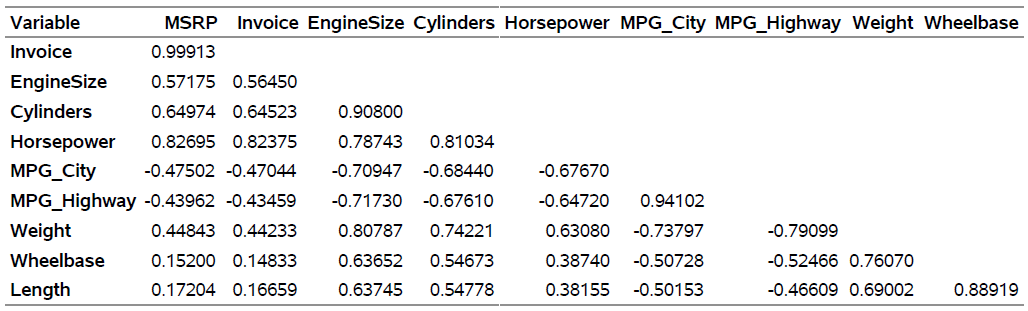
The following DATA step displays the lower triangle of the correlation matrix.
data p2;
   set p end=__eof;
   array __n[*] _numeric_;
   do __i = _n_ to dim(__n); __n[__i] = ._; end;
   if _n_ = 1 then do;
      call execute('data _null_; set p2;');
      call execute('file print ods=(template="Base.Corr.StackedMatrix"');
      call execute('columns=(rowname=variable');
   end;
   call execute(cats('matrix=',vname(__n[_n_]),'(generic)'));
   if __eof then call execute(')); put _ods_; run;');
run; |
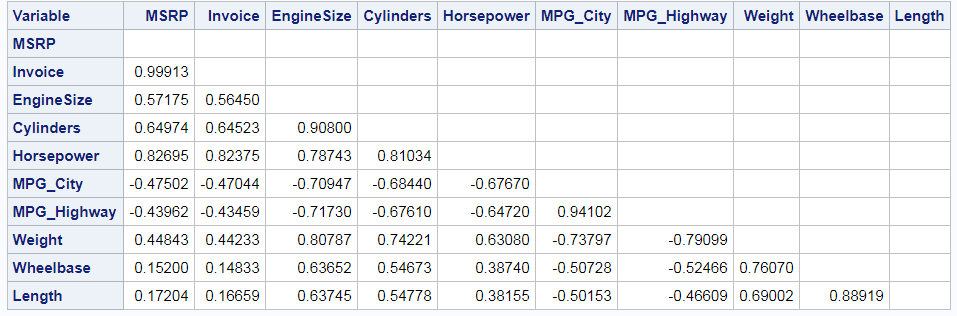
Nothing in the DATA step is specific to the input data set. The only part that is specific to the PROC CORR step is the name of the ODS output data set, P. The DATA step does two things. It modifies the correlation matrix so that all values on or above the diagonal are set to an underscore missing value. The template has a TRANSLATE statement that displays blanks in place of underscore missing values. The results from this data set modification are stored in the data set P2. The DATA P2 step also generates a second DATA step (a DATA _NULL_ step) that contains ad hoc rendering code that displays the modified matrix. The information needed to generate the rendering code is entirely contained in the ODS output data set. This enables the DATA P2 step to be general, whereas the generated code is ad hoc. In this example, the DATA P2 step uses CALL EXECUTE statements to generate and run the following DATA _NULL_ step (reformatted from its original form).
data _null_;
   set p2;
   file print ods=(template="Base.Corr.StackedMatrix"
                   columns=(rowname=variable
                            matrix=MSRP(generic)
                            matrix=Invoice(generic)
                            matrix=EngineSize(generic)
                            matrix=Cylinders(generic)
                            matrix=Horsepower(generic)
                            matrix=MPG_City(generic)
                            matrix=MPG_Highway(generic)
                            matrix=Weight(generic)
                            matrix=Wheelbase(generic)
                            matrix=Length(generic)));
   put _ods_;
run; |
The rendering code specifies the mapping between the template column name Rowname and the data set variable called Variable. This variable provides the row headers, which match the column headers, column names, and original input data set variable names. Since the columns of a correlation matrix cannot be known until the procedure runs, the columns are designated as GENERIC in the template column definition. The ODS template has a single placeholder column named Matrix for each correlation matrix column. The rendering code declares the mappings between the template generic column and the variables in the data set.
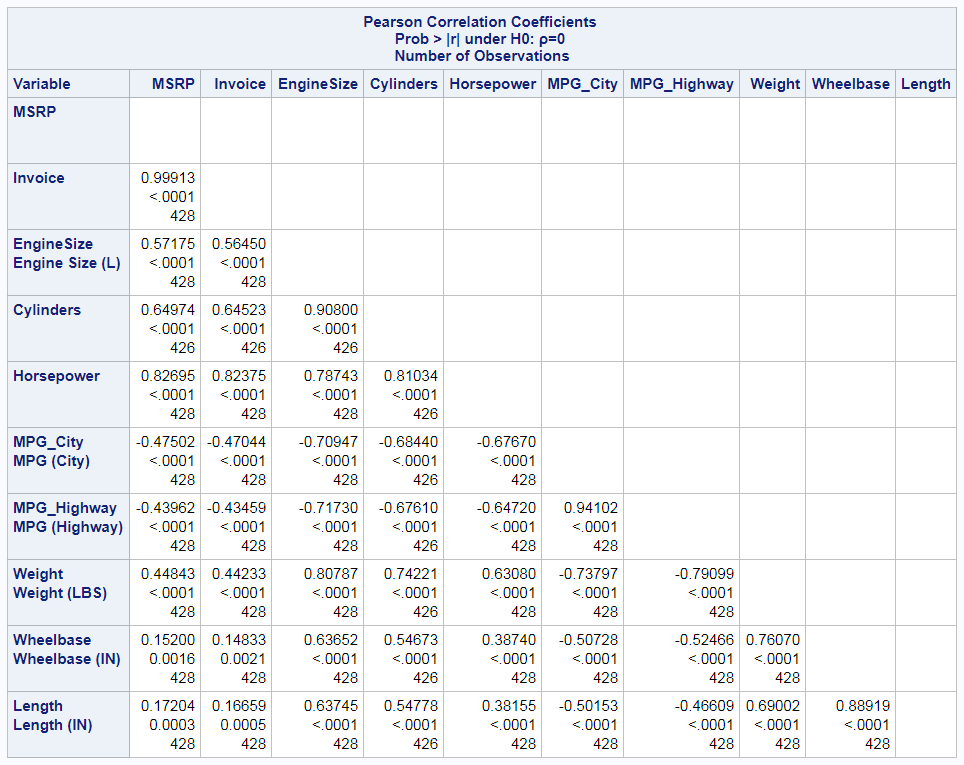
Notice that the DATA P2 step generates the P2 data set that is read by the DATA _NULL_ step. The DATA P2 step along with the DATA _NULL_ step that it generates display the lower triangle of the correlation matrix and nothing else. You might instead want to display the correlation matrix in almost the same form that PROC CORR does, but without the upper triangle. The next steps show you how to do that and how to change the style for the row label to RowHeader, so that the labels have the same light blue background as the variable names when displayed in the HMTLBlue style.
To fully recreate the correlation matrix outside of PROC CORR, you need all of the dynamic variables, which contain the table title and additional formatting information. You can access the dynamic variables by first storing the correlation matrix in an ODS document.
ods document name=MyDoc (write); proc corr data=sashelp.cars; ods select PearsonCorr; ods output PearsonCorr=p; run; ods document close; |
The ODS DOCUMENT statements open and close the ODS document, which stores all of the displayed information (tables, graphs, titles, footnotes, headers, after notes, and so on). The NAME= option assigns the document a name, and the WRITE option discards any information that might previously be in that document. I have frequently written that you can use the ODS document to capture dynamic variables and use them to recreate a graph. You can do the same thing with tables, but you will use a DATA step to recreate the table rather than using PROC SGRENDER to recreate the graph. You can use PROC DOCUMENT and the LIST statement to display the contents of the document.
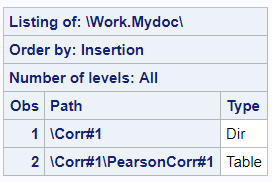
proc document name=MyDoc; list / levels=all; quit; |
Then you can copy the path for the correlation matrix from the listing of the document and paste it in an OBDYNAM (dynamic object) statement. The following step creates a data set called Dynamics that contains the names and values of the dynamic variables.
proc document name=MyDoc; ods exclude dynamics; ods output dynamics=dynamics; obdynam \Corr#1\PearsonCorr#1; quit; |
You can edit the dynamics. This step changes the title dynamic variable so that the Greek letter rho is displayed rather than "Rho".
data dynamics;
   length cValue1 $ 120;
   set dynamics;
   cvalue1 = tranwrd(cvalue1, 'Rho=', "(*ESC*){Unicode rho}=");
run; |
The following step edits the template that controls the row label and adds the STYLE=ROWHEADER option.
proc template; edit common.column.rowlabel; style=rowheader; end; quit; |
The following step sets the upper triangle for all three matrices (correlations, p values, and frequencies) to underscore missing and generates and executes code to display the table.
data p2(drop=__:);
   set p end=__eof nobs=__nobs;
   array __n[*] _numeric_;
   __dim = dim(__n);
   do __i = _n_ to __nobs;
      __n[__i] = ._;
      if __dim gt     __nobs then __n[__i +     __nobs] = ._;
      if __dim gt 2 * __nobs then __n[__i + 2 * __nobs] = ._;
   end;
   if _n_ = 1 then do;
      call execute('data _null_; set p2;');
      call execute('file print ods=(template="Base.Corr.StackedMatrix"');
      do __i = 1 to __ndynam;
         set dynamics(keep=cvalue1 label1 rename=(cvalue1=__c label1=__l))
             point=__i nobs=__ndynam;
         call execute(cats('dynamic=(', __l, '=', quote(trim(__c)), ')'));
      end;
      call execute('columns=(rowname=variable rowlabel=label');
   end;
   call execute(cats('matrix=',     vname(__n[_n_             ]), '(generic)'));
   if __dim gt __nobs     then
      call execute(cats('matrix2=', vname(__n[_n_ +     __nobs]), '(generic)'));
   if __dim gt 2 * __nobs then
      call execute(cats('matrix3=', vname(__n[_n_ + 2 * __nobs]), '(generic)'));
   if __eof then call execute(')); put _ods_; run;');
run; |
Much of this step is similar to the simpler DATA step shown previously, but now there is more code. Rather than setting one upper triangle to upper missing, we now set up to three to missing. The ODS output data set has up to three sets of numeric variables. The first set contains the correlations, and the variable names match the original input data set names. The second set contains the p values, and the variable names consist of the prefix 'P' followed by the original variable names (truncated if necessary). The third set contains the frequency counts when the frequencies are not all the same, and the variable names consist of the prefix 'N' followed by the original variable names (truncated if necessary). The stacked matrix template displays these three sets with corresponding rows stacked on top of each other. Now instead of one CALL EXECUTE statement that maps the generic column Matrix to all of the correlation variables, there are three CALL EXECUTE statements that map up to three generic columns (Matrix, Matrix2, and Matrix3) to up to three sets of variables. Furthermore the correspondence between the variable Label, which contains the original data set variable labels, and the template column is added to the same CALL EXECUTE statement that specifies that Variable is the variable that corresponds to the RowName template column. In the middle, a DO loop specifies the names and values of all of the dynamic variables. Temporary variables all begin with two underscores. This makes them easy to drop and minimizes the chances of them conflicting with variable names in the input data set. The DATA step generated and runs the following code, which I have reindented.
data _null_;
   set p2;
   file print ods=(template="Base.Corr.StackedMatrix"
      dynamic=(rs="10")
      dynamic=(csmin="2")
      dynamic=(csmax="6")
      dynamic=(header_text=";Pearson Correlation Coefficients ;Prob > |r| under H0: Rho=0 ;Number of Observations")
      dynamic=(ts="2")
      dynamic=(spill="1")
      dynamic=(space="1")
      dynamic=(cmwidth="8")
      dynamic=(id="1")
      columns=(rowname=variable
               rowlabel=label
               matrix=MSRP(generic)
               matrix2=PMSRP(generic)
               matrix3=NMSRP(generic)
               matrix=Invoice(generic)
               matrix2=PInvoice(generic)
               matrix3=NInvoice(generic)
               matrix=EngineSize(generic)
               matrix2=PEngineSize(generic)
               matrix3=NEngineSize(generic)
               matrix=Cylinders(generic)
               matrix2=PCylinders(generic)
               matrix3=NCylinders(generic)
               matrix=Horsepower(generic)
               matrix2=PHorsepower(generic)
               matrix3=NHorsepower(generic)
               matrix=MPG_City(generic)
               matrix2=PMPG_City(generic)
               matrix3=NMPG_City(generic)
               matrix=MPG_Highway(generic)
               matrix2=PMPG_Highway(generic)
               matrix3=NMPG_Highway(generic)
               matrix=Weight(generic)
               matrix2=PWeight(generic)
               matrix3=NWeight(generic)
               matrix=Wheelbase(generic)
               matrix2=PWheelbase(generic)
               matrix3=NWheelbase(generic)
               matrix=Length(generic)
               matrix2=PLength(generic)
               matrix3=NLength(generic)));
   put _ods_;
run; |
The following step deletes the modified template.
proc template; delete common.column.rowlabel / store=sasuser.templat; quit; |
CALL EXECUTE statements write the generated code to a buffer. The resulting DATA _NULL_ step executes after the DATA P2 step finishes.
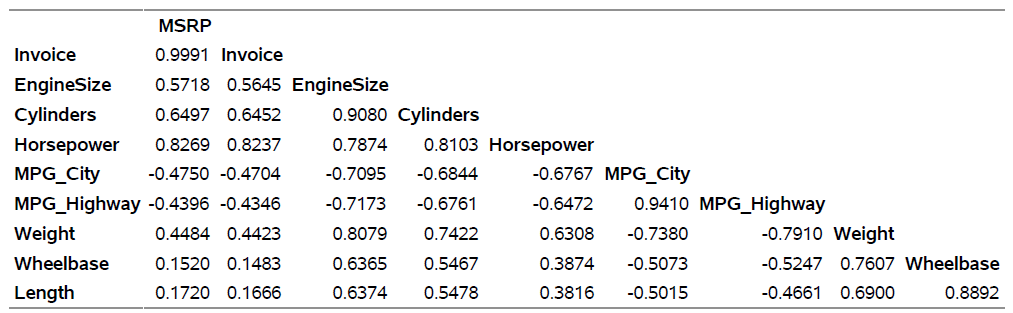
The following step uses the same ODS OUTPUT data set from PROC CORR, p, and displays the lower triangle, dropping the first row and last column, which are blank. Assume that the HTML destination is open from previous steps.
ods pdf style=pearlj;
data p2;
   set p end=__eof;
   array __n[*] _numeric_;
   do __i = _n_ to dim(__n); __n[__i] = ._; end;
   if _n_ = 1 then do;
      call execute('data _null_; set p2;');
      call execute('file print ods=(template="Base.Corr.StackedMatrix"');
      call execute('columns=(rowname=variable');
   end;
   if not __eof then call execute(cats('matrix=',vname(__n[_n_]),'(generic)'));
   if __eof then call execute(')); if _n_ ne 1 then put _ods_; run;');
run;
ods pdf close; |
This DATA step contains two IF conditions, IF NOT __EOF THEN and IF _N_ NE 1 THEN, that drop the last column and first row,
respectively.
Most tables in this post are displayed in the HTML destination using the HTMLBlue style. This one uses PDF and the PearlJ style.
You can remove the column headers and instead place the headers in the diagonals by modifying the template and using the CELLSTYLE statement to change the appearance of the diagonal.
data _null_;
   set p nobs=__nobs;
   call symputx('nobs', __nobs);
   stop;
run;

proc template;
   define table diag;
      column RowName Matrix;
      translate _val_=._ into "";
      define RowName;
         varname = Variable;
         parent = Common.Column.RowName
         print_headers=off;
      end;
      define matrix;
         width=12 just=r generic print_headers=off;
         cellstyle _row_ = (_col_-1) as
           data{backgroundcolor=white color=black fontweight=bold};
           * For HMTLBlue, use this instead of the previous line:
           data{backgroundcolor=cxEDF2F9 color=cx112277 fontweight=bold};
           ;
      end;
      split_stack = OFF;
   end;
quit;

ods pdf style=pearlj;
data p2;
   set p end=__eof;
   length __c1-__c&nobs $ 12;
   array __n[*] _numeric_;
   array __c[&nobs] $;
   __c[_n_] = vname(__n[_n_]);
   do __i = 1 to _n_ - 1;
      __c[__i] = put(__n[__i], 7.4);
   end;
   if _n_ = 1 then do;
      variable = ' ';
      call execute('data _null_; set p2;');
      call execute('file print ods=(template="diag"');
      call execute('columns=(rowname=variable');
   end;
   if not __eof then call execute(cats('matrix=',vname(__c[_n_]),'(generic)'));
   if __eof then call execute(')); put _ods_; run;');
run;
ods pdf close; |
You can display the upper triangle instead of the lower triangle by replacing the first DO loop by the second:
* Display lower. Blank out the upper.; do __i = _n_ to dim(__n); __n[__i] = ._; end; * Display upper. Blank out the lower.; do __i = 1 to _n_; __n[__i] = ._; end; |
You also need to skip the last row and the first column (instead of the first row and last column). The following steps change the format, display the upper triangle and use the %Paint autocall macro to display larger absolute values in red and values near zero in cyan.
%let inc = 0.01;
%paint(values=-1 to 1 by &inc, colors=red magenta cyan magenta red)

data cntlin;
   set colors;
   FmtName = 'paintfmt';
   Label = _rgb_;
   End = round(start + &inc, &inc);
   keep start end label fmtname;
run;

proc format cntlin=cntlin; run;

proc template;
   edit Base.Corr.StackedMatrix;
      column (RowName RowLabel) (Matrix);
      header 'Pearson Correlation Coefficients';
      edit matrix;   format=5.2 style = {foreground=paintfmt8. font_weight=bold};  end;
   end;
quit;

data p2;
   set p end=__eof;
   array __n[*] _numeric_;
   do __i = 1 to _n_; __n[__i] = ._; end;
   if _n_ = 1 then do;
      call execute('data _null_; set p2 end=__eof;');
      call execute('file print ods=(template="Base.Corr.StackedMatrix"');
      call execute('columns=(rowname=variable');
   end;
   if _n_ ne 1 then call execute(cats('matrix=',vname(__n[_n_]),'(generic)'));
   if __eof then call execute(')); if not __eof then put _ods_; run;');
run; |
The %Paint autocall macro generates a data set that contains a list of values (in this case in the range -1 to 1) and a list of colors that correspond to those values. You can use this data set to construct a format that can be specified in the template. ODS uses this format to control the colors of the values. Using the same modified template, you could instead interpolate from black to white via shades of gray for display in a black and white publication.
%paint(values=-1 to 1 by &inc, colors=black black black cxaaaaaa
       cx999999 cx333333 cx111111 white white white cx111111 cx333333
       cx999999 cxaaaaaa black black black)

data cntlin;
   set colors;
   FmtName = 'paintfmt';
   Label = _rgb_;
   End = round(start + &inc, &inc);
   keep start end label fmtname;
run;

proc format cntlin=cntlin; run;

ods pdf style=pearlj;
data p2;
   set p end=__eof;
   array __n[*] _numeric_;
   do __i = 1 to _n_; __n[__i] = ._; end;
   if _n_ = 1 then do;
      call execute('data _null_; set p2 end=__eof;');
      call execute('file print ods=(template="Base.Corr.StackedMatrix"');
      call execute('columns=(rowname=variable');
   end;
   if _n_ ne 1 then call execute(cats('matrix=',vname(__n[_n_]),'(generic)'));
   if __eof then call execute(')); if not __eof then put _ods_; run;');
run;
ods pdf close;

proc template;
   delete Base.Corr.StackedMatrix / store=sasuser.templat;
quit; |
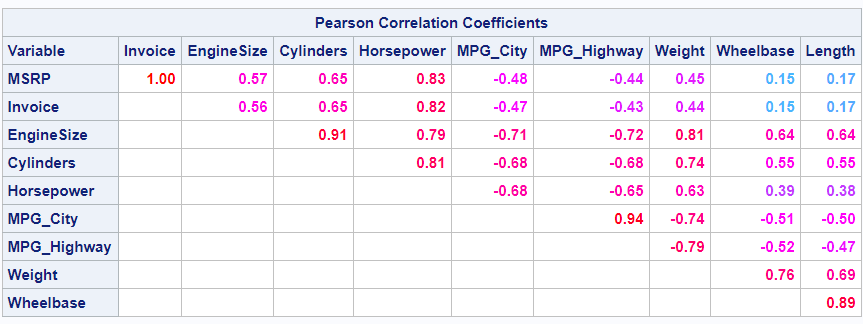
You might choose to display variable labels when they exist instead of variable names.
data p2(drop=__:);
   length variable $ 256;
   set p end=__eof;
   array __n[*] _numeric_;
   do __i = _n_ to dim(__n); __n[__i] = ._; end;
   if label ne ' ' then variable = label;
   if _n_ = 1 then do;
      call execute('data _null_; set p2;');
      call execute('file print ods=(template="Base.Corr.StackedMatrix"');
      call execute('columns=(rowname=variable');
   end;
   if not __eof then call execute(cats('matrix=',vname(__n[_n_]),'(generic)'));
   if __eof then do;
      call execute(')); label variable = "00"x ');
      do __i = 1 to __nobs;
         set p(keep=variable label rename=(variable=__vn label=__l))
             point=__i nobs=__nobs;
         call execute(catx(' ', __vn, '=', quote(trim(ifc(__l eq ' ', __vn, __l)))));
      end;
      call execute('; if _n_ ne 1 then put _ods_; run;');
   end;
run; |
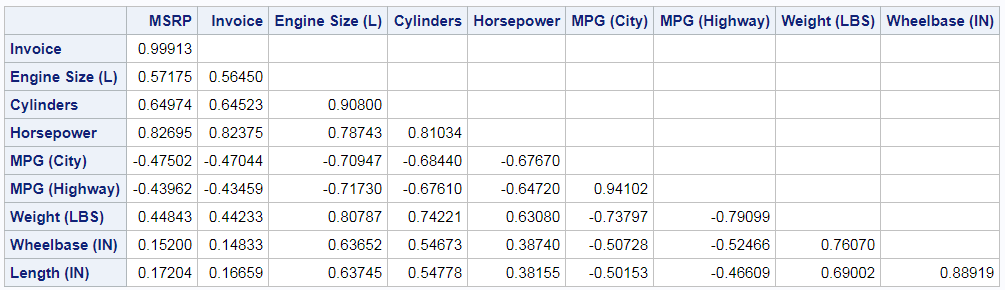
This step also omits the first (blank) row and the last (blank) column. The main part of the DATA step that is new is the DO loop near the end. It reads all of the names and labels and generates a LABEL statement in the DATA _NULL_ step that assigns the variable labels. This statement assigns a null label ("00"x) to the variable Variable so that no header is displayed for the first column. The DATA P2 step generates and runs the following DATA _NULL_ step.
data _null_;
   set p2;
   file print ods=(template="Base.Corr.StackedMatrix"
                   columns=(rowname=variable
                            matrix=MSRP(generic)
                            matrix=Invoice(generic)
                            matrix=EngineSize(generic)
                            matrix=Cylinders(generic)
                            matrix=Horsepower(generic)
                            matrix=MPG_City(generic)
                            matrix=MPG_Highway(generic)
                            matrix=Weight(generic)
                            matrix=Wheelbase(generic)));
   label variable = "00"x
         MSRP = "MSRP"
         Invoice = "Invoice"
         EngineSize = "Engine Size (L)"
         Cylinders = "Cylinders"
         Horsepower = "Horsepower"
         MPG_City = "MPG (City)"
         MPG_Highway = "MPG (Highway)"
         Weight = "Weight (LBS)"
         Wheelbase = "Wheelbase (IN)"
         Length = "Length (IN)";
   if _n_ ne 1 then put _ods_;
run; |
While I do not recall ever seeing anyone do this before, you can display the p-values in the upper triangle and the correlations in the lower triangle. Begin by storing the number of variables in a macro variable.
data _null_;
   set p nobs=__nobs;
   call symputx('nobs', __nobs);
   stop;
run; |
Since the correlations and p-values need to use different formats, we need to store the formatted values in a character variable. This means we need a new template.
proc template;
   define table randp;
      column RowName Matrix;
      translate _val_=._ into "";
      define header t;
         text ';Lower Triangle: Correlations;Upper Triangle: p-Values';
      end;
      define RowName;
         varname = Variable;
         parent = Common.Column.RowName;
      end;
      define matrix;
         width=7 just=r generic;
      end;
      split_stack = OFF;
   end;
quit; |
The RowName column is the same. Now Matrix is a generic character column that is right justified. The template has a custom header for this example. The following step modifies the data set, generates the rendering code, and runs it. Now, there is a new character array, __c. Values from the first two sets of columns are formatted into the character array. The rendering code is modified to use those character variables. The original names appear as row and column headers.
data p2;
   set p end=__eof;
   array __n[*] _numeric_;
   array __c[&nobs] $;
   do __i = _n_ + 1 to &nobs;
      __c[__i] = put(__n[__i + &nobs], pvalue7.4);
   end;
   do __i = 1 to _n_ - 1;
      __c[__i] = put(__n[__i], 7.4);
   end;
   if _n_ = 1 then do;
      call execute('data _null_; set p2;');
      call execute('file print ods=(template="randp"');
      call execute('columns=(rowname=variable');
   end;
   call execute(cats('matrix=',vname(__c[_n_]),'(generic)'));
   if __eof then do;
      call execute(')); label variable = "00"x ');
      do __i = 1 to &nobs;
         call execute(catx(' ', cats('__c', __i), '=', quote(trim(vname(__n[__i])))));
      end;
      call execute('; put _ods_; run;');
   end;
run; |
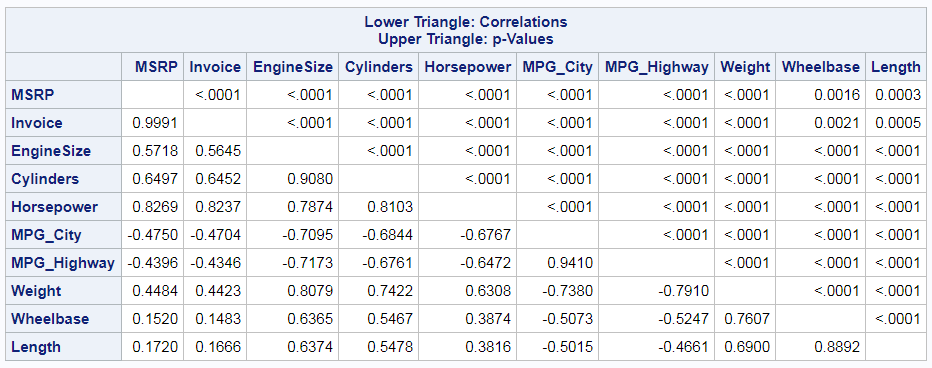
The DATA P2 step generates and runs the following rendering code.
data _null_;
   set p2;
   file print ods=(template="randp"
                   columns=(rowname=variable
                            matrix=__c1(generic)
                            matrix=__c2(generic)
                            matrix=__c3(generic)
                            matrix=__c4(generic)
                            matrix=__c5(generic)
                            matrix=__c6(generic)
                            matrix=__c7(generic)
                            matrix=__c8(generic)
                            matrix=__c9(generic)
                            matrix=__c10(generic)));
   label variable = "00"x
         __c1 = "MSRP"
         __c2 = "Invoice"
         __c3 = "EngineSize"
         __c4 = "Cylinders"
         __c5 = "Horsepower"
         __c6 = "MPG_City"
         __c7 = "MPG_Highway"
         __c8 = "Weight"
         __c9 = "Wheelbase"
         __c10 = "Length";
   put _ods_;
run; |
Obviously, this post is more concerned with ODS than with ODS Graphics. However, you can also display one of the triangles in a graph. The following step extracts one triangle of the correlation matrix and stores it in a form suitable for making a heat map. The variables Row and Col contain the row and column coordinates (both variable names) for discrete axes. Double underscores are again used to make the code reusable while minimizing the chance of colliding with input data set variable names.
data heat(keep=__row __col __r __t rename=(__t=t __r=r __col=Col __row=row));
   set p;
   array __n[*] _numeric_;
   if _n_ = 1 then do;  /* Ensure a symmetric range around zero by appending  */
      __r = -1; output; /* values of -1 and 1 to the data.  These are skipped */
      __r =  1; output; /* in the plot due to the missing values in the       */
   end;                 /* other variables.                                   */
   do __i = 1 to _n_ - 1;
      __Col = variable;
      __Row = vname(__n[__i]);
      __R   = __n[__i];
      __T   = put(__n[__i], 5.2);
     output;
   end;
run; |
The following step creates the plot.
ods graphics on / height=7in width=7.5in;
proc sgplot data=heat noautolegend noborder;
   title 'Lower Triangle of a Correlation Matrix';
   heatmapparm x=row y=col colorresponse=r / name='h'
               colormodel=(cxff3333 cxff55ff cx5555ff cxbbffff
                           cx5555ff cxff55ff cxff3333);
   text        x=row y=col text=t / textattrs=(weight=bold size=12pt);
   gradlegend 'h' / notitle;
   xaxis display=(noline nolabel noticks);
   yaxis display=(noline nolabel noticks) reverse;
run; |

In summary, there are many ways to post-process tables that analytical procedures display. By using ODS OUTPUT, template modification, dynamic variables, DATA steps, and CALL EXECUTE, you have a great deal of freedom to customize your results. If I did not show precisely the customization that you like, you can extract pieces from the other customizations to create even more types of tables or graphs.


4 Comments
Dear Professor Kuhfeld: Thank you for this (and for the extraordinary guidance we get from your work in general)! I ran into an issue when I tried creating the lower triangle stacked version. P2 appears to have three matrices side-by-side, not stacked.
The log gives the following error:
49 + matrix=pcs13(generic)
50 + matrix2=Ppcs13(generic)
51 + matrix3=Npcs13(generic)
52 + )); put _ods_; run;
ERROR: The variable label in the ODS COLUMNS=/VARIABLES= list has
never been referenced.
NOTE: The SAS System stopped processing this step because of
errors.
NOTE: DATA statement used (Total process time):
real time 0.04 seconds
cpu time 0.04 seconds
I am referring to the following code:
data p2(drop=__:);
set p end=__eof nobs=__nobs;
array __n[*] _numeric_;
__dim = dim(__n);
do __i = _n_ to __nobs;
__n[__i] = ._;
if __dim gt __nobs then __n[__i + __nobs] = ._;
if __dim gt 2 * __nobs then __n[__i + 2 * __nobs] = ._;
end;
if _n_ = 1 then do;
call execute('data _null_; set p2;');
call execute('file print ods=(template="Base.Corr.StackedMatrix"');
do __i = 1 to __ndynam;
set dynamics(keep=cvalue1 label1 rename=(cvalue1=__c label1=__l))
point=__i nobs=__ndynam;
call execute(cats('dynamic=(', __l, '=', quote(trim(__c)), ')'));
end;
call execute('columns=(rowname=variable rowlabel=label');
end;
call execute(cats('matrix=', vname(__n[_n_ ]), '(generic)'));
if __dim gt __nobs then
call execute(cats('matrix2=', vname(__n[_n_ + __nobs]), '(generic)'));
if __dim gt 2 * __nobs then
call execute(cats('matrix3=', vname(__n[_n_ + 2 * __nobs]), '(generic)'));
if __eof then call execute(')); put _ods_; run;');
run;
Thanks for the kind words! Below I show the full code including the required steps that precede that last step. It works for me. If your code is not working, please send me a small and completely self contained example that reproduces the problem.
ods document name=MyDoc (write);
proc corr data=sashelp.cars;
   ods select PearsonCorr;
   ods output PearsonCorr=p;
run;
ods document close;

proc document name=MyDoc;
   ods exclude dynamics;
   ods output dynamics=dynamics;
   obdynam \Corr#1\PearsonCorr#1;
quit;

data dynamics;
   length cValue1 $ 120;
   set dynamics;
   cvalue1 = tranwrd(cvalue1, 'Rho=', "(*ESC*){Unicode rho}=");
run;

proc template;
   edit common.column.rowlabel; style=rowheader; end;
quit;

ods html body='b.html';
data p2(drop=__:);
   set p end=__eof nobs=__nobs;
   array __n[*] _numeric_;
   __dim = dim(__n);
   do __i = _n_ to __nobs;
      __n[__i] = ._;
      if __dim gt     __nobs then __n[__i +     __nobs] = ._;
      if __dim gt 2 * __nobs then __n[__i + 2 * __nobs] = ._;
   end;
   if _n_ = 1 then do;
      call execute('data _null_; set p2;');
      call execute('file print ods=(template="Base.Corr.StackedMatrix"');
      do __i = 1 to __ndynam;
         set dynamics(keep=cvalue1 label1 rename=(cvalue1=__c label1=__l))
             point=__i nobs=__ndynam;
         call execute(cats('dynamic=(', __l, '=', quote(trim(__c)), ')'));
      end;
      call execute('columns=(rowname=variable rowlabel=label');
   end;
   call execute(cats('matrix=',     vname(__n[_n_             ]), '(generic)'));
   if __dim gt __nobs     then
      call execute(cats('matrix2=', vname(__n[_n_ +     __nobs]), '(generic)'));
   if __dim gt 2 * __nobs then
      call execute(cats('matrix3=', vname(__n[_n_ + 2 * __nobs]), '(generic)'));
   if __eof then call execute(')); put _ods_; run;');
run;
ods html close;
Also, are you sure that you have not changed the template? If you run this step
do you you see that the template comes soly from tmplbase?
Listing of: SASHELP.TMPLBASE Path Filter is: Base.Corr.StackedMatrix Sort by: PATH/ASCENDING Obs Path Type ---------------------------------------- 1 Base.Corr.StackedMatrix TableDr. Kuhfeld is one of those that prevents SAS users from going into full-blown insanity. I am one of the thousands that have benefited from his work. However, just from a "user-friendliness" perspective, SAS is is a torture chamber. It is truly sad that software that costs in the tens of thousands will require torture like this for producing a simple output.
Not just this. Pretty much any decent output you need from SAS, you are going to have to go this kind of hoops.
Help,
after trying your codes I got a problem: level of significance (p) are no more appearing in my tables; even restarting SAS or PC. Thanks