Axis tables are one of our favorite topics in Graphically Speaking. In this post, I will show you how to add special characters (Unicode) to axis table columns. (There are many posts about Unicode characters.) The first two examples are ad hoc. The last three examples use a general macro that makes it easy to add special characters with minimal processing.
When you specify options, you can add a special character to a graph by directly specifying an escaped Unicode specification such as: (*ESC*){Unicode '2265'x}. For the values of an axis table, the specification must be indirect. The Unicode specifications must not be in your input data set. Instead, you must create a numeric variable (usually the row number) and a format. (You cannot do this by using a character variable.) The values from the format contain all of the values that are to be displayed including the Unicode specifications. Consider a simple example.
data x;
   input age f;
   datalines;
1 .
2 20
3 10
;

proc format;
   value agefmt 1 = 'Age'
                2 = "< 12"
                3 = "(*ESC*){Unicode '2265'x} 12";
run;

ods graphics on / width=2in height=1.5in;
proc sgplot data=x;
   yaxistable age / position=left nolabel valuejustify=left
                    valueattrs=(size=15);
   hbarparm category=age response=f / barwidth=0.3;
   format age agefmt.;
   yaxis display=none;
   xaxis display=none;
run; |
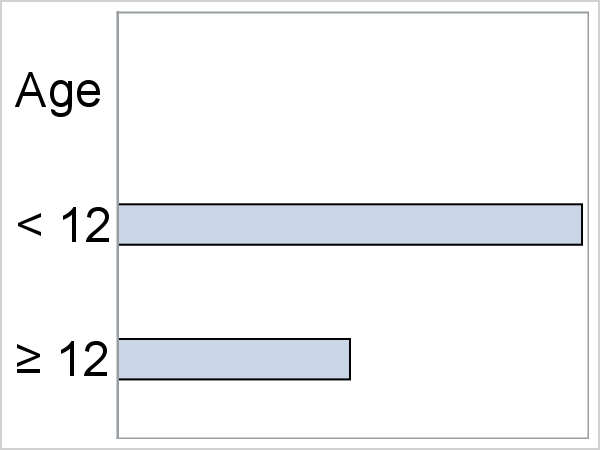
The values 1, 2, and 3 are mapped via a format to the values that are displayed on the left side of the graph. The last row includes the Unicode character for greater than or equal to. In a real example, you might find it inconvenient to create a format via PROC FORMAT and a VALUE statement. You can programatically create a format by creating a CNTLIN= data set for PROC FORMAT that has a special structure and specific variables. You start with an input data set.
data x2; input Age $ 1-8 f; AxisVar = _n_; datalines; Age . < 12 20 >= 12 10 ; |
This input data set is more natural than the previous one. It contains the frequency variable and the actual age values and a placeholder for greater than or equal to ('>='). It contains one other variable, AxisVar, that contains the row number. The following steps create a format that maps the row number to the values that are to be displayed.
data cntlin(keep=type fmtname start label);
   set x2;
   Type    = 'n';
   FmtName = "NewAgeFmt";
   Start   = axisvar;
   Label   = tranwrd(age, '>=', "(*ESC*){Unicode '2265'x}");
run;

proc format cntlin=cntlin; quit;

proc print; run; |
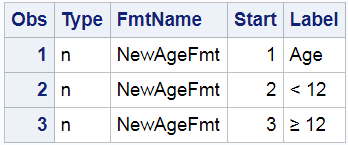
PROC PRINT in the HTML destination shows the greater than or equal to sign. The LISTING destination shows the escape and Unicode sequence. The Type variable specifies that the format is numeric. The FmtName variable contains the format name; you can create more than one format at a time. The Start variable contains the numeric row number. The Label variable contains that character string that will be displayed in the axis table. The TRANWRD function changes '>=' to the Unicode specification. PROC FORMAT creates a format named NewAgeFmt from the CNTLIN= data set.
The following step creates the same graph as before. Notice that the variable AxisVar is now specified in the YAXISTABLE statement. It is also specified in the FORMAT statement so that the values that are defined in the new format are displayed.
proc sgplot data=x2;
   yaxistable axisvar / position=left nolabel valuejustify=left
                        valueattrs=(size=15);
   hbarparm category=age response=f / barwidth=0.3;
   format axisvar newagefmt.;
   yaxis display=none;
   xaxis display=none;
run; |
The DATA CNTLIN step suggests an approach that you can use to make format creation easier and more general. The following step reads a data set and creates two output data sets: a CNTLIN= data set for PROC FORMAT and a new DATA= data set that contains a new numeric axis table variable.
%macro cntlin(                   /*--------------------------------------------*/
              data=_last_,       /* Input data set.                            */
              out=,              /* Output data set. Default: &data.2.         */
              fmtname=myfmt,     /* Format name.                               */
              var=,              /* Name of input variable for the format.     */
              axisvar=AxisVar,   /* Name of output numeric row number variable.*/
              lablen=500);       /* Length of Label variable in format.        */
                                 /*--------------------------------------------*/
%if &data=_last_ %then %let data=&syslast;
%if %nrbquote(&out) eq %then %let out = &data.2;
data __cntlin(keep=_fmtname _start _type _label
              rename=(_fmtname=FmtName _start=Start _type=Type _label=Label))
         &out(drop=_fmtname _type _label rename=(_start=&axisvar));
   set &data;
   length _label $ &lablen;
   _type = 'n';
   _fmtname = "&fmtname";
   if &var ne ' ' then _start = _n_;
   _label = &var;
   %do i = 1 %to 24;
      %let l = %scan(alpha beta gamma delta epsilon zeta eta theta iota kappa lambda
               mu nu xi omicron pi rho sigma tau upsilon phi chi psi omega, &i);
      %let u = %sysfunc(propcase(&l,));
      _label = tranwrd(_label, "\&l", "(*ESC*){Unicode &l}");
      _label = tranwrd(_label, "\&u", "(*ESC*){Unicode &l._u}");
   %end;
   _label = tranwrd(_label, '\inf', "(*ESC*){Unicode '221e'x}"); * Infinity;
   _label = tranwrd(_label, '\deg', "(*ESC*){Unicode '00B0'x}"); * Degree;
   _label = tranwrd(_label, '\eur', "(*ESC*){Unicode '20AC'x}"); * Euro;
   _label = tranwrd(_label, '\cen', "(*ESC*){Unicode '00A2'x}"); * Cent;
   _label = tranwrd(_label, '\cop', "(*ESC*){Unicode '00a9'x}"); * Copyright;
   _label = tranwrd(_label, '\bul', "(*ESC*){Unicode '2022'x}"); * Bullet;
   _label = tranwrd(_label, '\mid', "(*ESC*){Unicode '00B7'x}"); * Middle dot;
   _label = tranwrd(_label, '\tim', "(*ESC*){Unicode '00D7'x}"); * Multiply;
   _label = tranwrd(_label, '\emd', "(*ESC*){Unicode '2014'x}"); * Em dash (long dash);
   _label = tranwrd(_label, '\smi', "(*ESC*){Unicode '263a'x}"); * Smile;
   _label = tranwrd(_label, '\lra', "(*ESC*){Unicode '2194'x}"); * Left-right arrow;
   _label = tranwrd(_label, '\la',  "(*ESC*){Unicode '2190'x}"); * Left arrow;
   _label = tranwrd(_label, '\ra',  "(*ESC*){Unicode '2192'x}"); * Right arrow;
   _label = tranwrd(_label, '\ua',  "(*ESC*){Unicode '2191'x}"); * Up arrow;
   _label = tranwrd(_label, '\da',  "(*ESC*){Unicode '2193'x}"); * Down arrow;
   _label = tranwrd(_label, '\tm',  "(*ESC*){Unicode '2122'x}"); * Trade mark;
   _label = tranwrd(_label, '\b',   "(*ESC*){Unicode '00A0'x}"); * Nonbreaking space;
   _label = tranwrd(_label, '<=',   "(*ESC*){Unicode '2264'x}"); * Less than or equal;
   _label = tranwrd(_label, '>=',   "(*ESC*){Unicode '2265'x}"); * Greater than or equal;
   _label = tranwrd(_label, '~=',   "(*ESC*){Unicode '2248'x}"); * Approximately equal;
   _label = tranwrd(_label, '^2',   "(*ESC*){Unicode '00B2'x}"); * Superscript 2;
   _label = tranwrd(_label, '_i',   "(*ESC*){Unicode '1D62'x}"); * Subscript i;
   _label = tranwrd(_label, '+-',   "(*ESC*){Unicode '00B1'x}"); * Plus or minus;
   _label = tranwrd(_label, '^=',   "(*ESC*){Unicode '2260'x}"); * Not equal;
   output &out;
   if n(_start) then output __cntlin;
run;

proc format cntlin=__cntlin; quit;
%mend; |
By default, the macro makes a numeric format called MyFmt, but you can change the name. It creates a format based on the values of the VAR= character variable. Typically, the VAR= contains mostly ordinary text. You can additionally add special tags (character strings that begin with a backslash) that get converted to Unicode. The tags \alpha through \omega are transformed into the corresponding lowercase Greek letters. The tags \Alpha through \Omega are transformed into the corresponding uppercase Greek letters. The tag \inf is transformed into infinity. The tag \deg is transformed into the degree symbol. You can read the code to see the other symbols that are available. There are thousands of Unicode symbols, and only a few are provided here. Usually, you can easily find a new Unicode specification by searching the web for "Unicode" and a description of the symbol of interest. You can easily modify the macro if you need other symbols. If you modify the macro, you need to be cognizant of the sequence of processing. The translation of \b (nonbreaking space) occurs after both \beta and \bul. If it had come before, it would have broken those two translations. For example, if \b comes before \beta in the program then the \b of \beta gets translated into the nonbreaking space specification followed by 'eta'. For example, this means that you cannot add a new \mult definition after the definition of \mu.
The test data set Syms is in the full code. It has a line for each symbol that the macro can handle. Here are a few lines from it.
data syms; input l $ 30.; n = _n_; len = length(l); datalines; le <= 12 \inf infinity Omega \Omega ; |
You can call the macro, for example as follows.
%cntlin(data=syms, var=l) |
It makes two data sets. From the input data set Syms, it creates another data set Syms2, which contains all of the original variables and the manufactured variable AxisVar that you must specify in the YAXISTABLE statement. Many of the characters are unchanged. However, '<=', \inf, and \Omega are transformed to Unicode characters. The following step creates the graph.
ods graphics on / width=4in height=10in;
proc sgplot data=syms2;
   yaxistable axisvar / position=left nolabel
                        valueattrs=(family="Arial Unicode MS1");
   hbarparm response=len category=n / barwidth=0.5;
   format axisvar myfmt.;
   yaxis display=none type=discrete type=discrete;
   xaxis display=none;
run; |
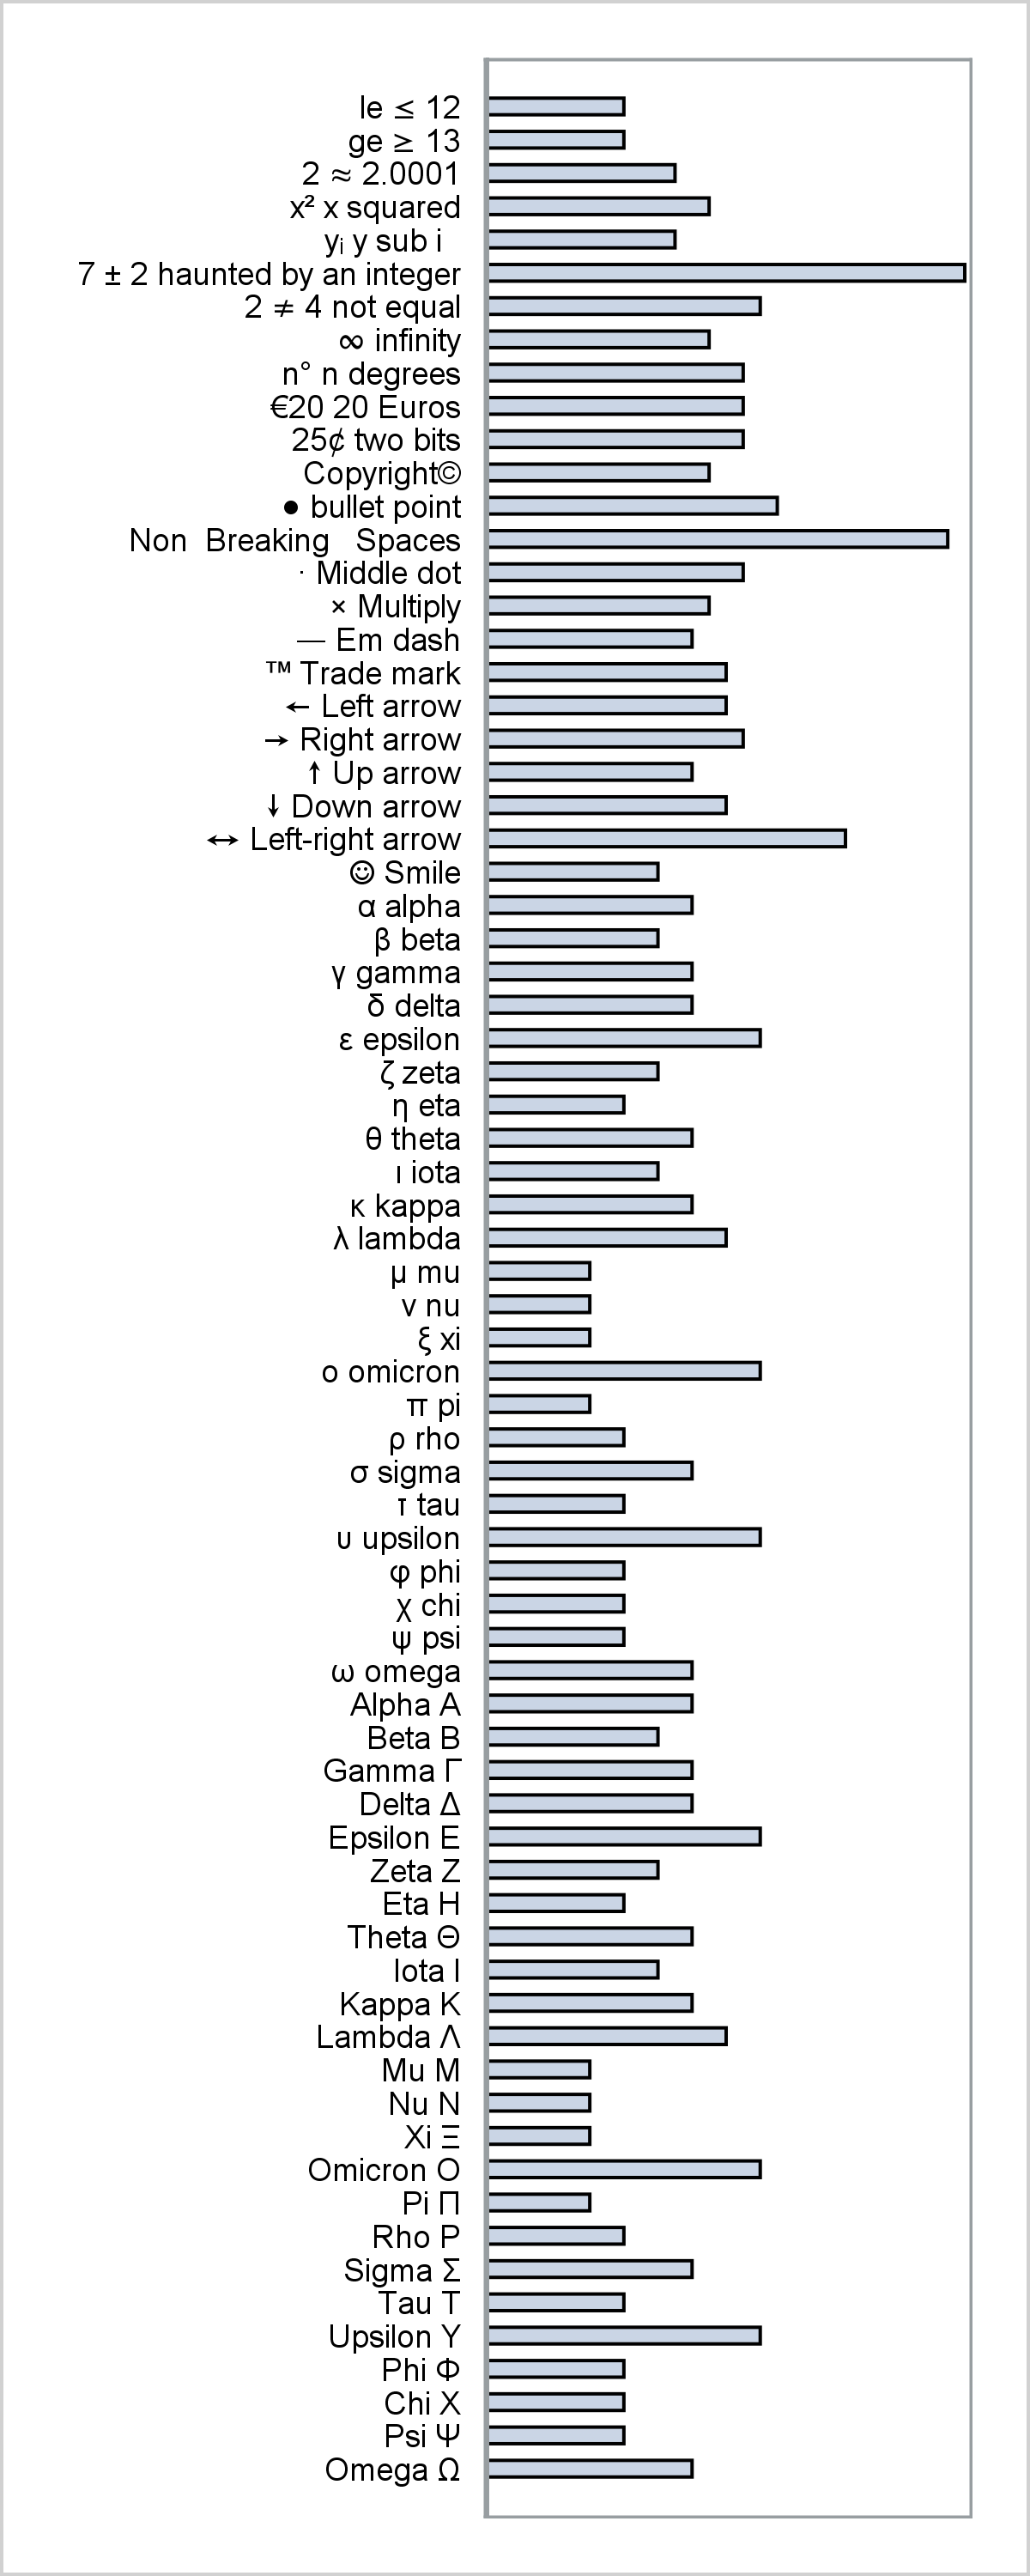
The graph shows a mix of text and special characters appearing in varying places in the values. You might or might not want spaces after one of the special characters. The data set contains \eur20 and the first four characters are replaced leaving the '20' after it.
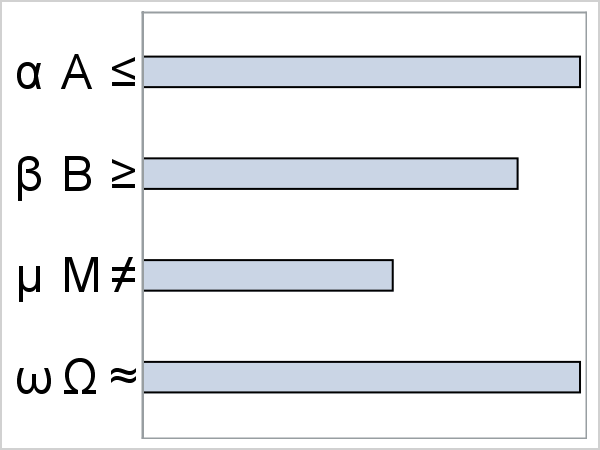
The following steps show that you can handle multiple axis table columns as well.
data x3;
   input l1 $ l2 $ l3 $;
   len = length(l1) + length(l2) + length(l3);
   datalines;
\alpha \Alpha  <=
\beta  \Beta   >=
\mu    \Mu     ^=
\omega \Omega  ~=
;

%cntlin(data=x3, out=x4, var=l1, fmtname=fmta, axisvar=v1)
%cntlin(data=x4, out=x5, var=l2, fmtname=fmtb, axisvar=v2)
%cntlin(data=x5, out=x6, var=l3, fmtname=fmtc, axisvar=v3)

ods graphics on / width=2in height=1.5in;
proc sgplot data=x6;
   format v1 fmta. v2 fmtb. v3 fmtc.;
   yaxistable v1 / position=left nolabel valuejustify=left
                   valueattrs=(size=15);
   yaxistable v2 / position=left nolabel valuejustify=left
                   valueattrs=(size=15);
   yaxistable v3 / position=left nolabel valuejustify=left
                   valueattrs=(size=15);
   hbarparm category=v1 response=len / barwidth=0.3;
   yaxis display=none;
   xaxis display=none;
run; |
The previous examples are all teaching examples and so are not very realistic. I will end with a more realistic example. I will borrow the starting point from one of Sanjay's forest plot blogs. His data and graph have a '<=', that I will turn into a less than or equal to sign. His example uses the INDENTWEIGHT= option to indent some rows. That works with a character variable, but we need a numeric variable and a format. So I also insert six nonbreaking spaces into the front of values that are indented. Then I create the format and the new DATA= data set that has the variable AxisVar.
data mine;
   set forest_subgroup_2;
   if indentwt then subgroup = repeat('\b', 5) || subgroup;
run;

%cntlin(data=mine, var=subgroup) |
My PROC SGPLOT step is almost identical to Sanjay's. I changed the data set name. I added the variable AxisVar and its format to the FORMAT statement. I changed the variable name in the first YAXISTABLE statement, dropped the INDENTWEIGHT=indentWt option, and added VALUEJUSTIFY=LEFT and LABEL='Subgroup'.
options missing=' ';
title j=r h=7pt '4-Yr Cumulative Event Rate';
ods graphics / reset width=5in height=3in;
proc sgplot data=mine2 nowall noborder nocycleattrs dattrmap=attrmap noautolegend;
  format text $txt. axisvar myfmt.;
  styleattrs axisextent=data;
  refline ref / lineattrs=(thickness=13 color=cxf0f0f7);
  highlow y=obsid low=low high=high;
  scatter y=obsid x=mean / markerattrs=(symbol=squarefilled);
  scatter y=obsid x=mean / markerattrs=(size=0) x2axis;
  refline 1 / axis=x;
  text x=xl y=obsid text=text / position=bottom contributeoffsets=none strip;
  yaxistable axisvar  / location=inside position=left textgroup=id labelattrs=(size=7)
             textgroupid=text valuejustify=left label='Subgroup' labeljustify=left;
  yaxistable countpct / location=inside position=left labelattrs=(size=7) valueattrs=(size=7);
  yaxistable PCIGroup group pvalue / location=inside position=right pad=(right=15px)
             labelattrs=(size=7) valueattrs=(size=7);
  yaxis reverse display=none colorbands=odd colorbandsattrs=(transparency=1) offsetmin=0.0;
  xaxis display=(nolabel) values=(0.0 0.5 1.0 1.5 2.0 2.5);
  x2axis label='Hazard Ratio' display=(noline noticks novalues) labelattrs=(size=8);
run; |
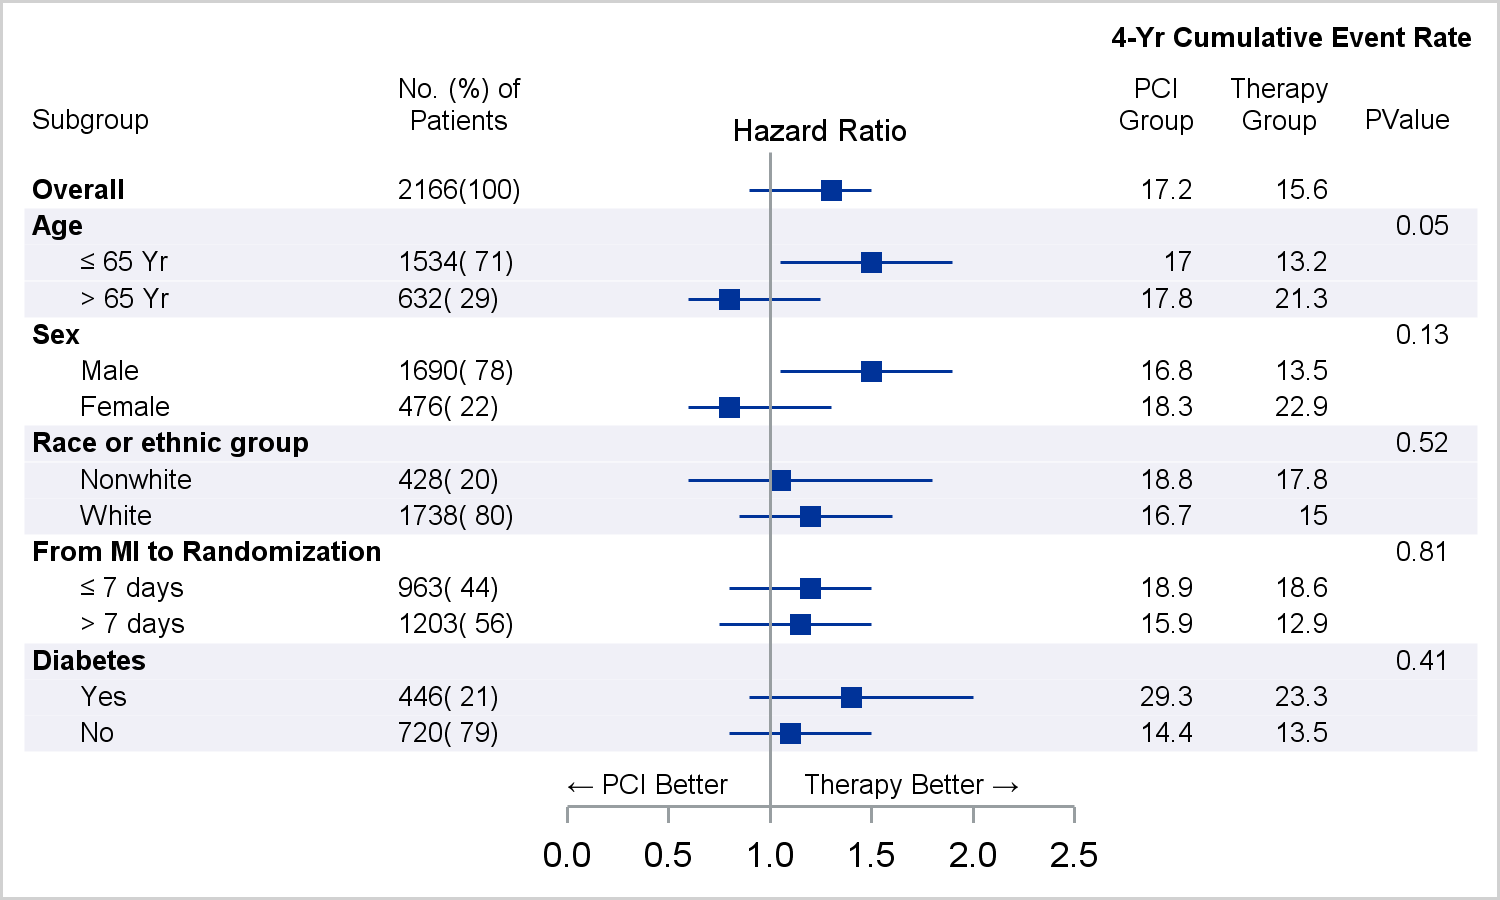
The graph has a less than or equal to sign and uses nonbreaking spaces to indent. The macro makes it easy to display special characters. Also see John O'Leary's PharmaSUG paper, How to Create a Journal Quality Forest Plot, to see how to add special characters by using SG Annotation.


1 Comment
This article taught me so many things. One problem I ran into was when multiple formatted rows have the same formatted value (supposed you're analyzing several Yes/No subgroups). The only way I could hack my way around this was to tack spaces onto the end of the repeats (eg, the first Yes is just Yes, but the second one is Yes\b, the third is Yes\b\b, etc.).