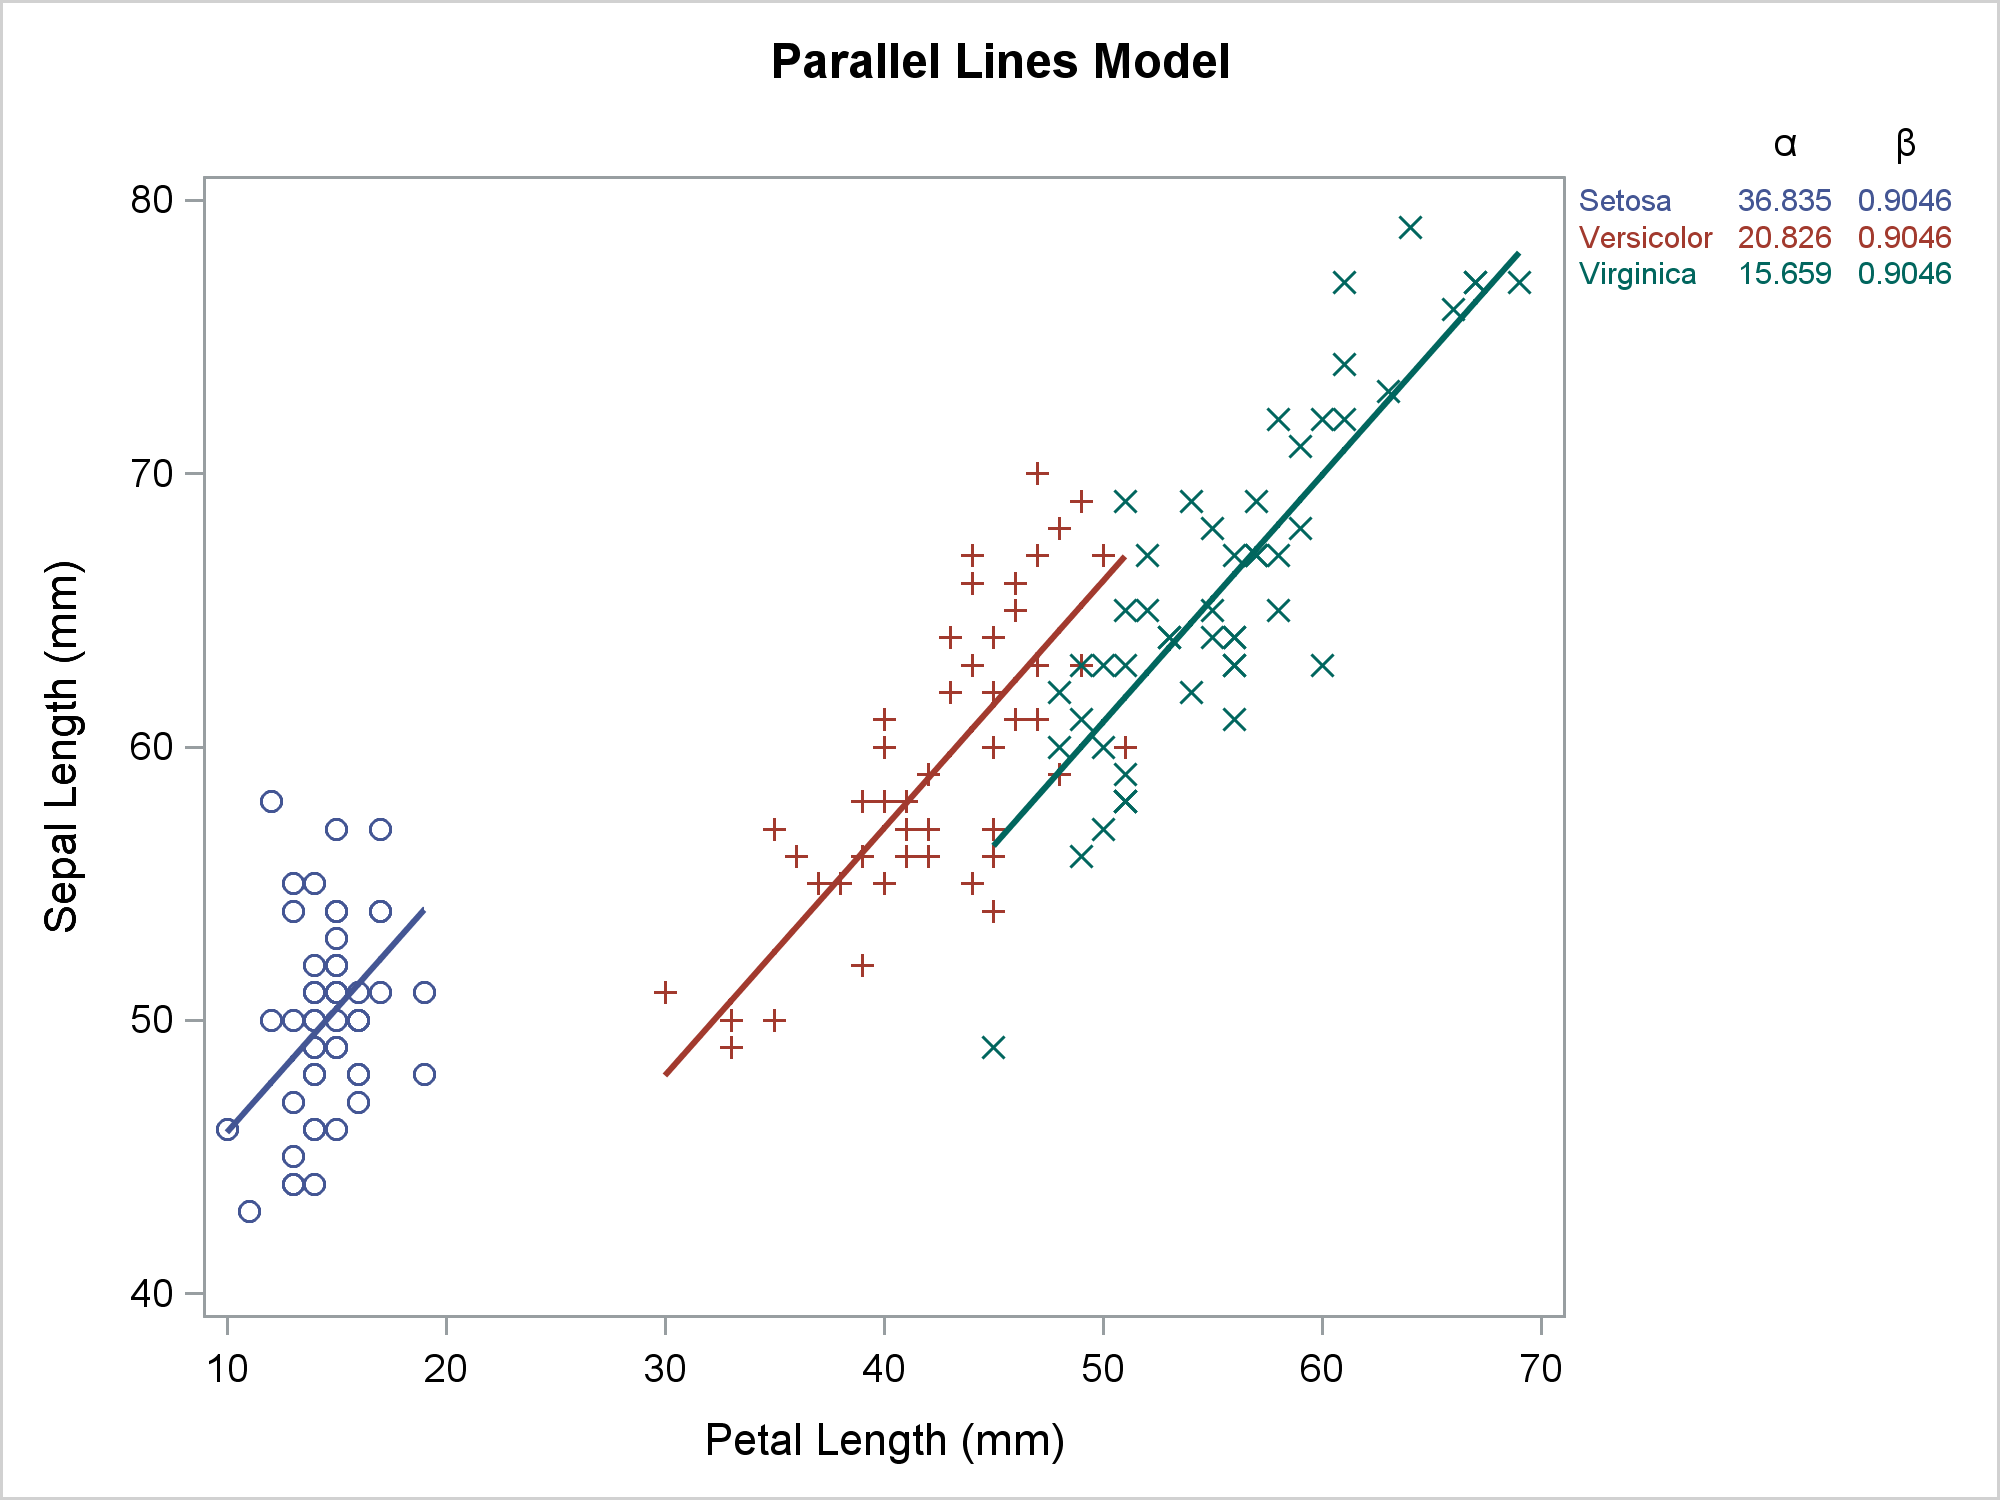
Displaying a grouped regression fit plot along with the parameter estimates

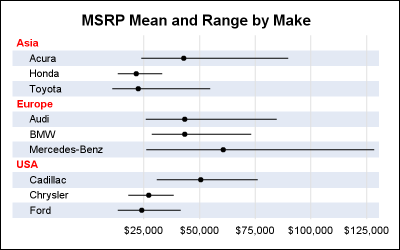
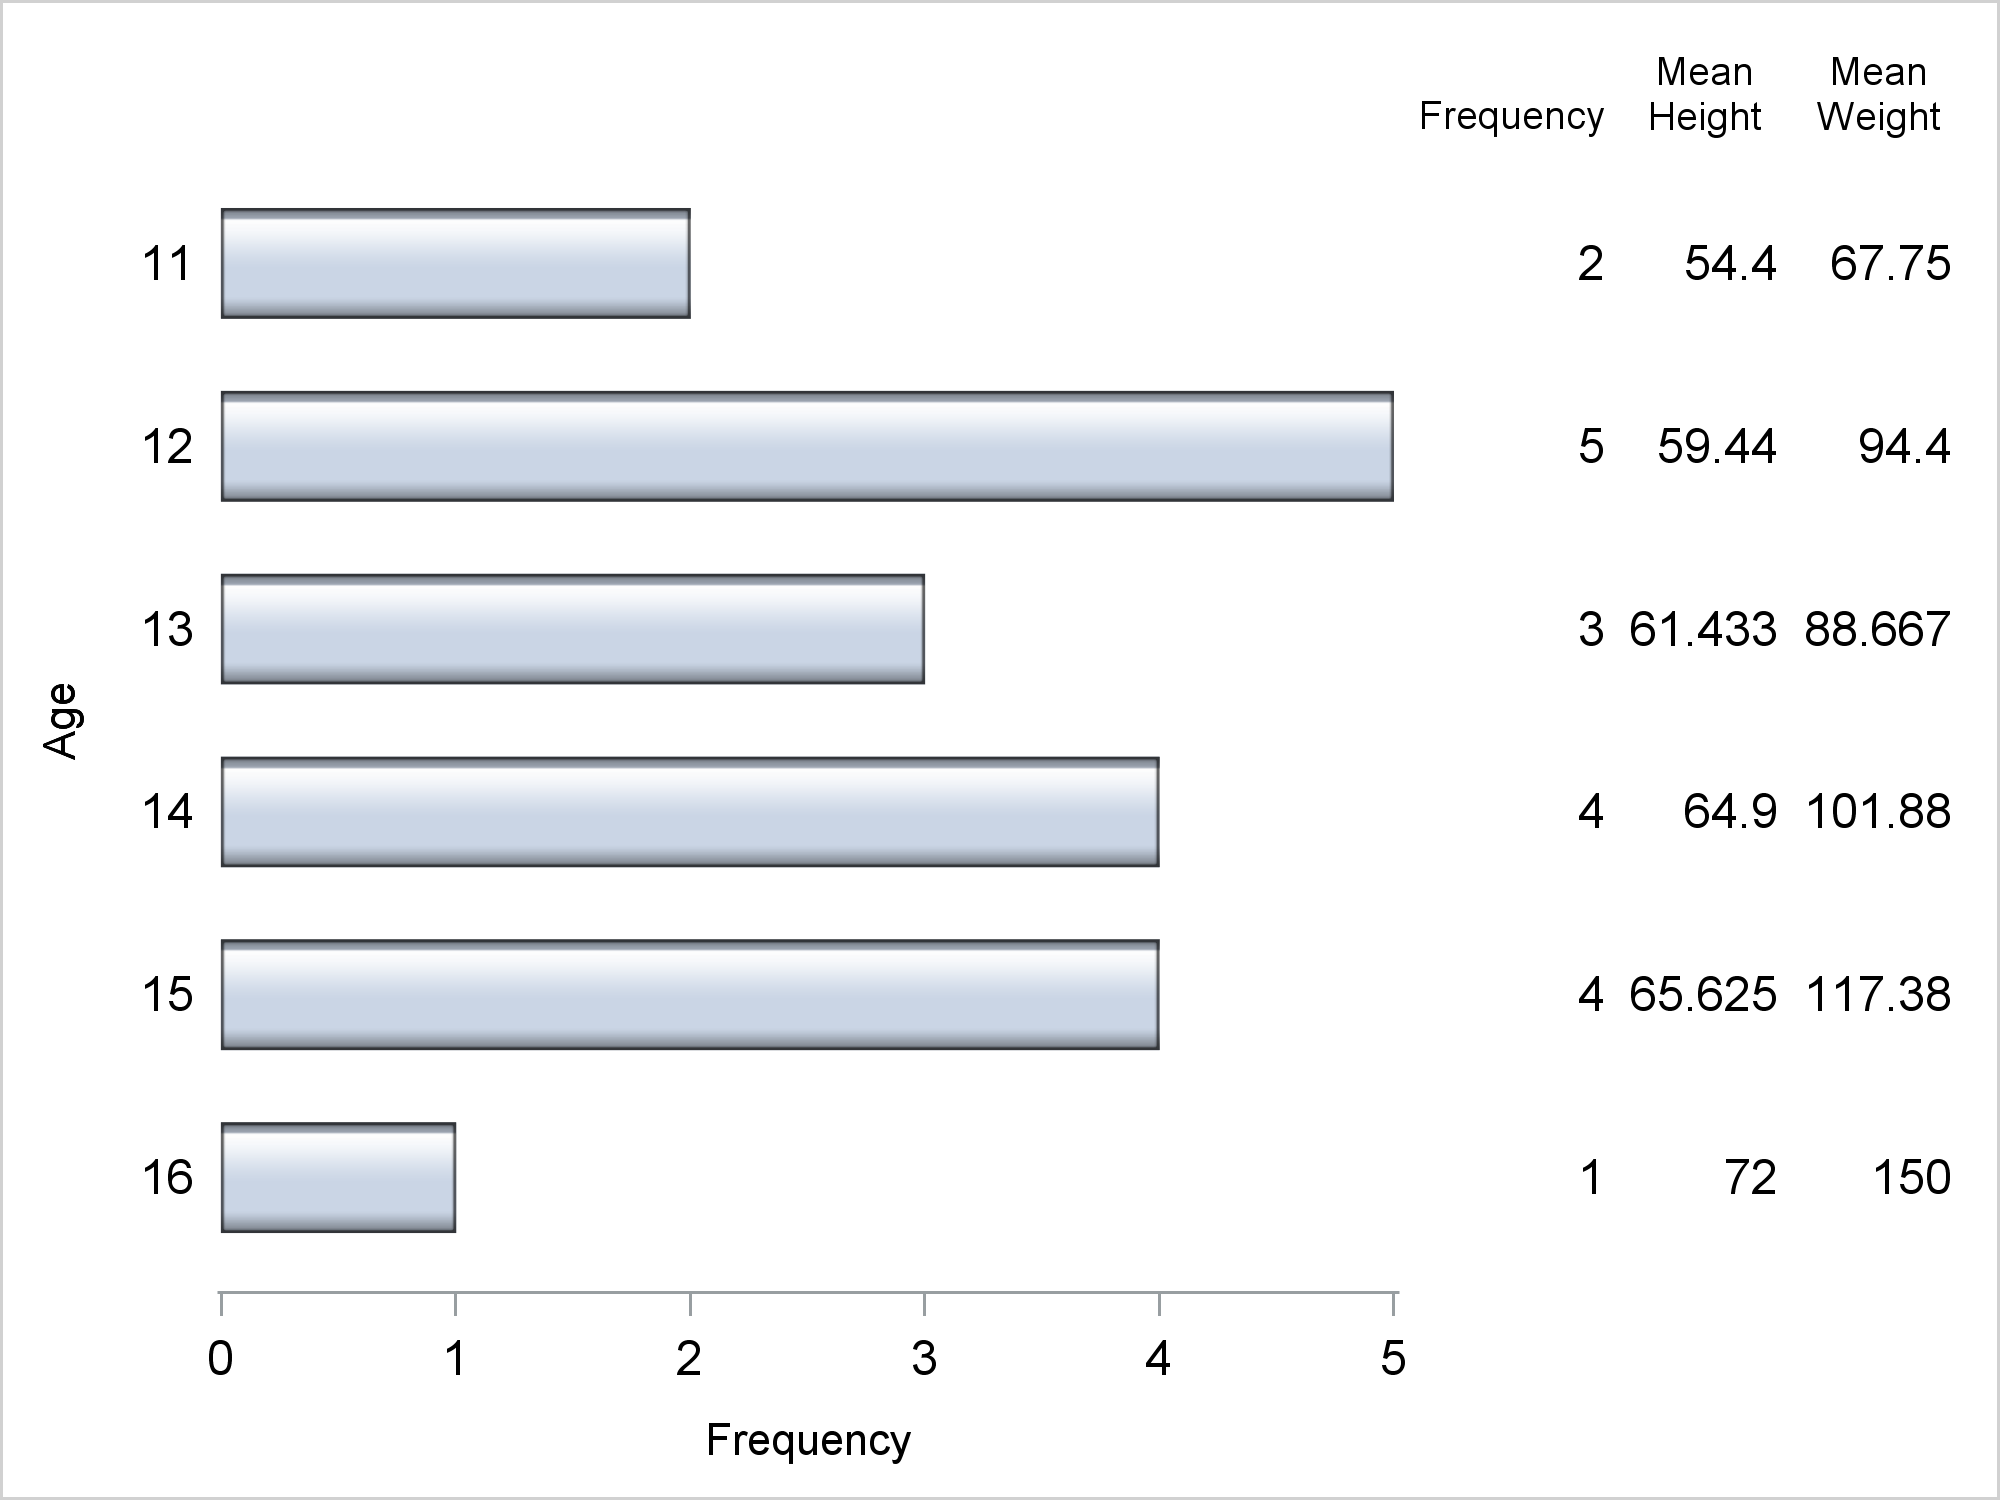
Usually, you use axis tables when there is a clear link between the rows of the axis table and the graph. I'll show how to use an axis table to create a table that is independent of the graph. This post also uses discrete attribute maps.