Have you ever wanted to see examples of all of the output styles that SAS provides, or have you ever wondered what the attribute priority is for every style? It is hard to make an informed choice about styles if you can't see output that uses them. Maybe Meadow is the perfect style for you, but you would never know it if you can't see it. You can run this program and look at the resulting file, styles.html, to see an example of output that uses each style. This post explains more about SAS styles including a discussion of attribute priority.
SAS provides more than 50 output styles. Styles (like tables and graphs) are defined by an ODS template. An ODS style template provides formatting information for specific visual aspects of your SAS output. The appearance of tables and graphs is coordinated within a particular style. For tables, this information includes a list of fonts and a list of colors. Colors are associated with common areas of output, including titles, footnotes, BY groups, table headings, and table cells. For graphs, ODS styles also control the appearance of graph elements, including lines, markers, fonts, and colors. ODS styles also include elements specific to statistical graphics, such as the style of fitted lines, confidence bands, and prediction limits.
Styles vary in many ways. Most are color; some are black-and-white. Some have white backgrounds, some have black backgrounds, and some use other colors. For an overview of some of the styles used for statistical graphics, see ODS Style Comparisons in the SAS/STAT documentation. What if you want to see more styles than this chapter shows? You can start by running the following step to list all of the styles.
proc template; list styles; quit; |
This step produces a list of over 50 style names (not shown). Seeing the style names is not the same as seeing what the styles look like. This next step displays all of the definitions, but this listing (not shown), contains too much information.
proc template; /* displays more information than is helpful */ source styles; quit; |
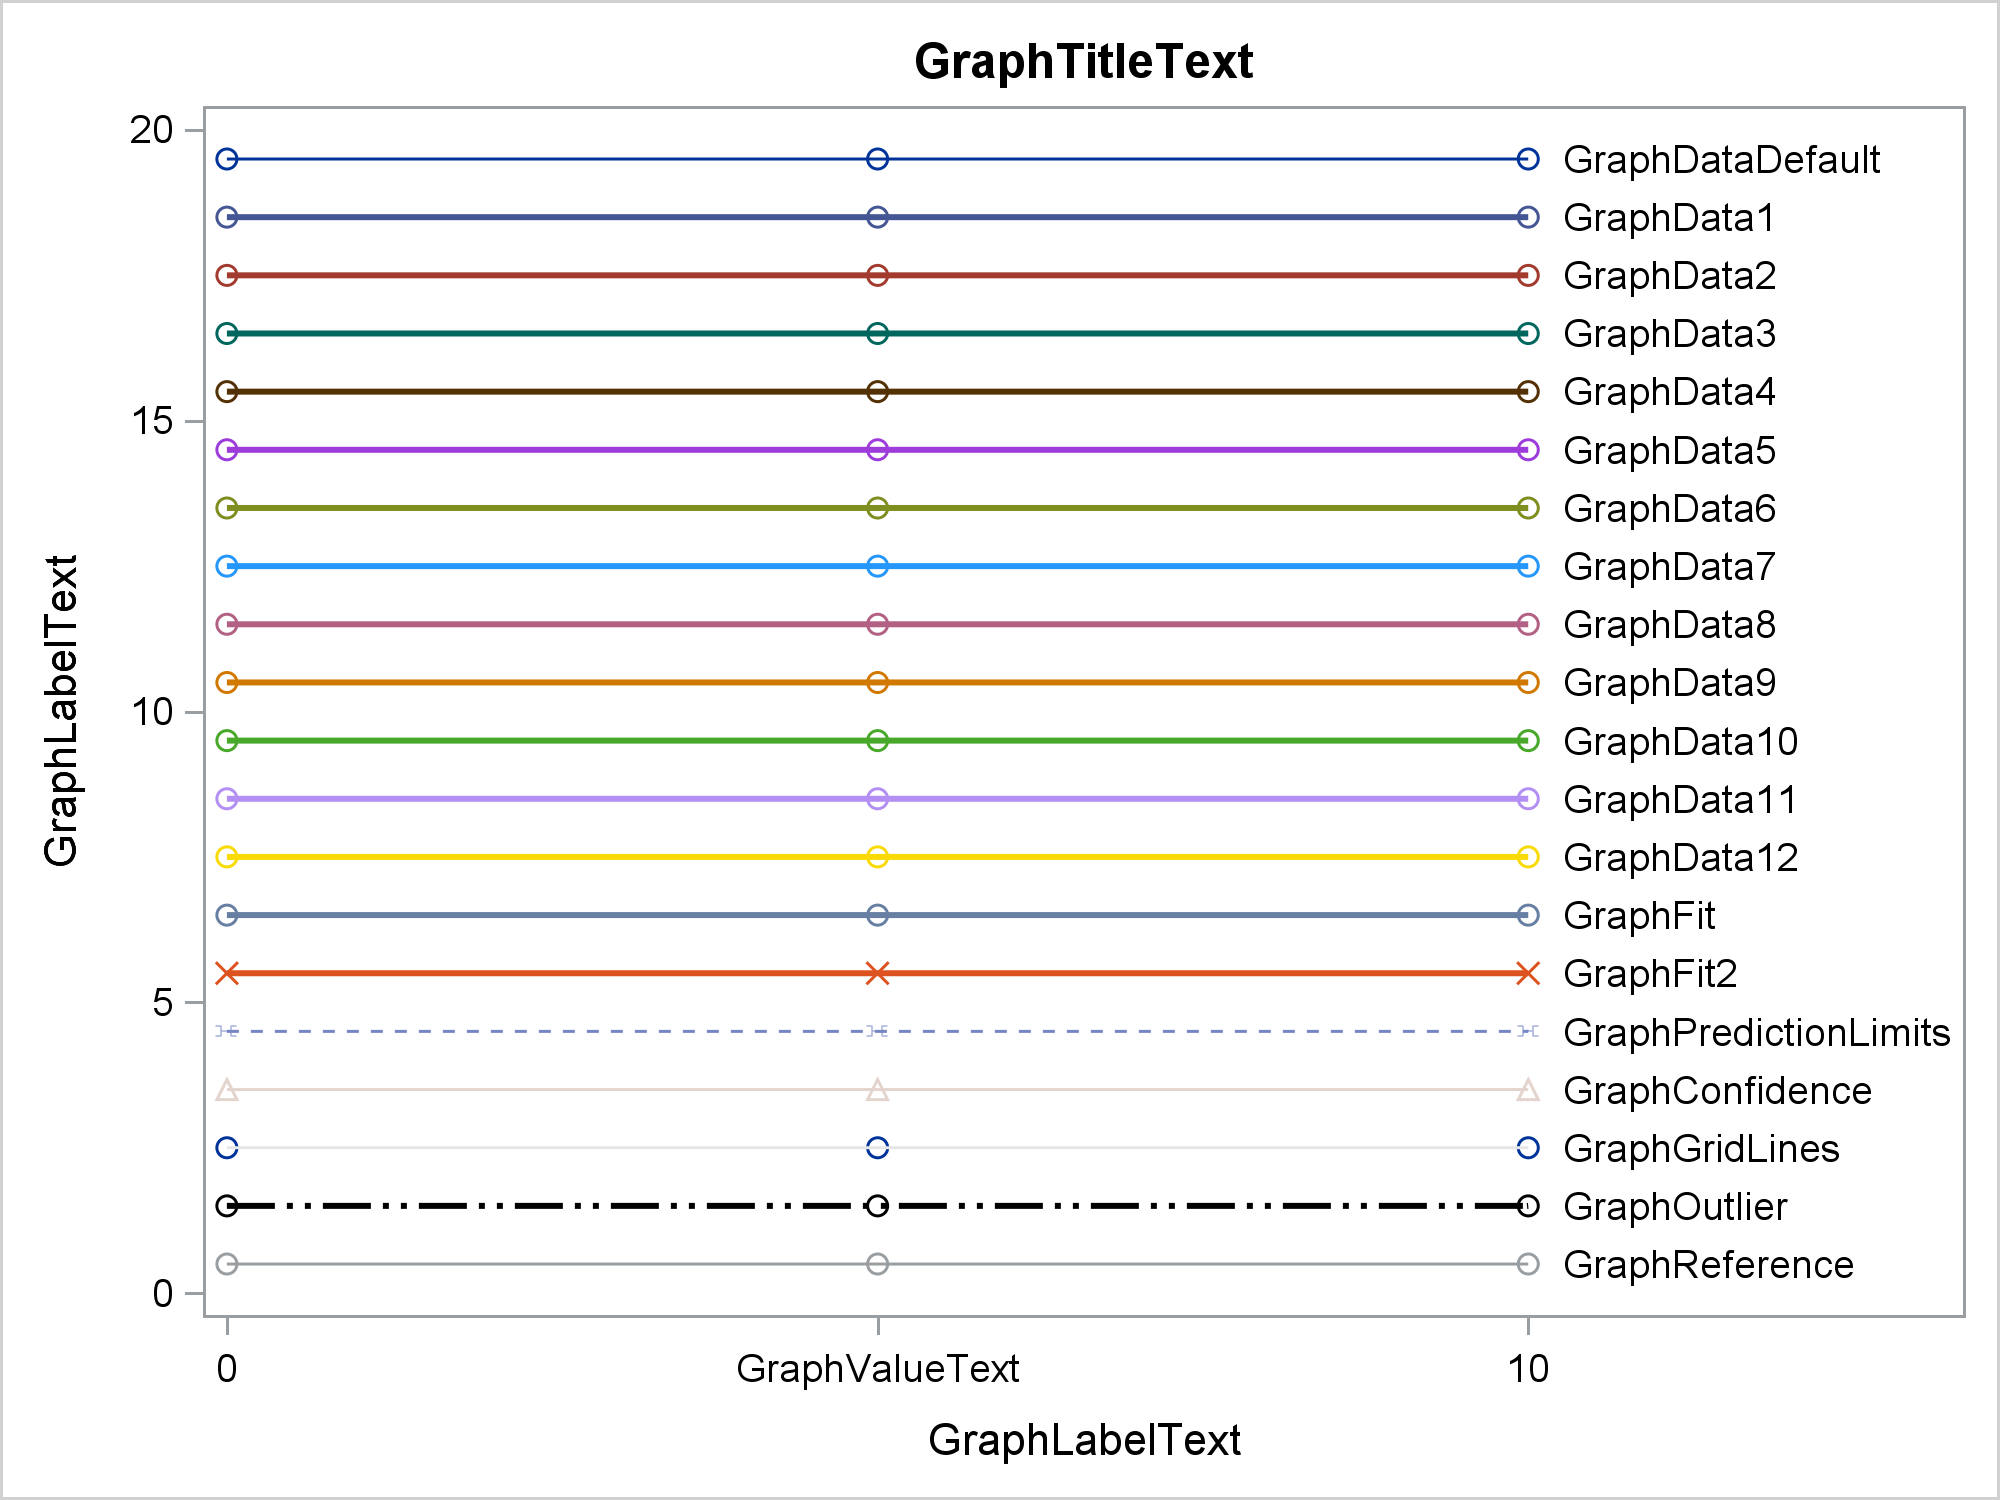
Furthermore, this step displays text and nothing visual. The documentation section Some Common ODS Style Elements shows the following program, which can give you insights into some aspects of styles.
proc format;
   value vf 5 = 'GraphValueText';
run;

data x1;
   array y[20] y0 - y19;
   do x = 1 to 20; y[x] = x - 0.5; end;
   do x = 0 to 10 by 5; output; end;
   label y0 = 'GraphLabelText' x = 'GraphLabelText' y18 = 'GraphLabelText';
   format x y0 vf.;
run;

%macro d;
   %do i = 1 %to 12;
      reg y=y%eval(19-&i) x=x / lineattrs=GraphData&i markerattrs=GraphData&i
                                curvelabel="  GraphData&i" curvelabelpos=max;
   %end;
%mend;

%macro l(i, l);
   reg y=y&i x=x / lineattrs=&l markerattrs=&l curvelabel="  &l"
                   curvelabelpos=max;
%mend;

proc sgplot noautolegend data=x1;
   title "GraphTitleText";
   %d
   %l(19, GraphDataDefault)
   %l( 6, GraphFit)
   %l( 5, GraphFit2)
   %l( 4, GraphPredictionLimits)
   %l( 3, GraphConfidence)
   %l( 2, GraphGridLines)
   %l( 1, GraphOutlier)
   %l( 0, GraphReference)
   xaxis values=(0 5 10);
run; |
The documentation section ODS Style Comparisons shows in graphs how several style elements are displayed. Here are the results for the HTMLBlue style.
Soon, I will show you an easy way to make a graph like this for every style. The code relies on one of my favorite techniques. I use a DATA step and CALL EXECUTE to call PROC SGPLOT once for each style. First, the call to PROC SGPLOT is stored in a macro.
%macro makeplot;
   proc sgplot noautolegend data=x1;
      title "GraphTitleText - &st";
      %d
      %l(19, GraphDataDefault)
      %l( 6, GraphFit)
      %l( 5, GraphFit2)
      %l( 4, GraphPredictionLimits)
      %l( 3, GraphConfidence)
      %l( 2, GraphGridLines)
      %l( 1, GraphOutlier)
      %l( 0, GraphReference)
      xaxis values=(0 5 10);
   run;
%mend; |
Then all of the style template names are stored in a SAS data set.
ods _all_ close; ods exclude all; ods listing; proc template; ods output stats=styles; list styles; quit; ods exclude none; |
Then you can use a DATA step to create a PNG file for each style template.
data _null_;
   set styles(where=(type='Style'));
   call execute(catx(' ', 'ods listing style=', path, ';'));
   call symputx('st', path);
   call execute(catx(' ', 'ods graphics on / reset=all imagename=',
                quote(cats(scan(path, 2))), ';'));
   call execute('%makeplot');
   call execute('ods listing close;');
run; |
For each style, CALL EXECUTE statements generate two ODS LISTING statements, an ODS GRAPHICS statement, and a macro call. The DATA step also sets a macro variable that is used in the graph title.
The PNG file names match the style. Examples include: Analysis.png, HTMLBlue.png, and Sapphire.png. Depending on your operating system, you can look at them on your computer.
Now, what if you want to see all of them in HTML? You can run the following step to include each of the PNG files into an HTML web page.
title;
ods listing close;
ods escapechar='~';
ods html file='styles.html';
data _null_;
   set styles(where=(type='Style'));
   call execute(cats('ods text="', path, '";'));
   call execute(cats("ods text=""~S={preimage='",
                scan(path, 2), ".png'", "}"";"));
run;
ods html close; |
The name of each graph is displayed before the graph by an ODS TEXT statement, so that you can search for names. Example:
ods text="Styles.Meadow"; |
Each graph is displayed by another ODS TEXT statement. Example:
ods text="~S={preimage='Meadow.png'}"; |
If you are familiar with some of my writings over the past few years, you probably know that I love to use CALL EXECUTE. Once you learn to think in terms of writing a program that writes a program, a whole new world of SAS programming is open to you. Usually, we think of the macro language when we think in terms of writing a program that writes a program. This and many of my other applications lately are different. I use a DATA step and CALL EXECUTE because the program I want to write depends in some way on the contents of a DATA set. So I process the data set in a DATA step and write the program that then runs immediately after the DATA step concludes.
Click here for the complete program that you can run to see all of the styles. The results are stored in the file styles.html.
You might wonder why I did not simply open the HTML destination and then repeatedly change the styles. When the HTML destination is opened, it begins with a style sheet, so you cannot keep changing the style and get the expected results.
While this post shows you how to display all of the styles, it does not begin to show you all of the ways you can easily change the styles in useful ways. In some applications, my favorite style is HTMLBlue, but I prefer the markers to vary as groups change while all of the lines are solid. To fully understand how I do that, you need to understand attribute priority. Attribute priority is a frequently mentioned topic in Graphically Speaking, SAS Communities, and SAS documentation.
There are two types of ODS styles:
The ODS GRAPHICS statement option ATTRPRIORITY=NONE is often required when you use both a STYLEATTRS statement and an ATTRPRIORITY=COLOR style such as HTMLBlue. Group colors, contrast colors, marker symbols, marker sizes, line styles, line thicknesses, and fill patterns are all defined in the GraphData1 through GraphData12 style elements. The values that you specify in the STYLEATTRS statement override those style definitions, but specifying a STYLEATTRS statement does not force your specifications to be used. You will see the second marker or line style (or the second of any of the other attributes, excluding color) only when the attribute priority is NONE. The attribute priority can be set to NONE in three ways.
The style definition for the HTMLBlue style, which is an ATTRPRIORITY=COLOR style, is quite similar to its parent style, Statistical, which is an ATTRPRIORITY=NONE style. The results of the following step (not shown) show that the GraphData1 through GraphData12 style elements, which distinguish groups, come from Default style, from which both HTMLBlue and Statistical inherit style attributes.
proc template; source styles.htmlblue / expand; quit; |
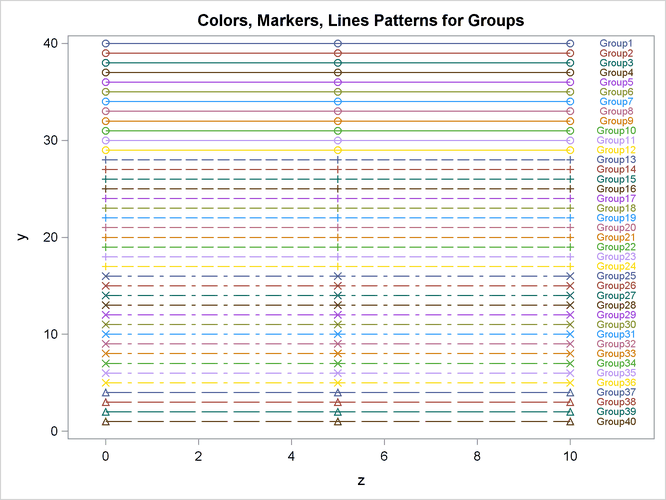
Those style elements define a series of markers (circle, plus, X, triangle, square, and so on), a series of line styles (1, 4, 8, 5, 14, and so on), and a series of colors and contrast colors. The difference is that with an ATTRPRIORITY=COLOR style, the markers and lines are not varied until the thirteenth group as this graph from ODS Style Comparisons shows.
The following step changes the attribute priority to NONE and specifies the STYLEATTRS statement to override the line patterns so that they are all solid while the markers vary for each group.
ods graphics / attrpriority=none; proc sgplot noautolegend data=x1; title "GraphTitleText"; styleattrs datalinepatterns=(solid); %d %l(19, GraphDataDefault) %l( 6, GraphFit) %l( 5, GraphFit2) %l( 4, GraphPredictionLimits) %l( 3, GraphConfidence) %l( 2, GraphGridLines) %l( 1, GraphOutlier) %l( 0, GraphReference) xaxis values=(0 5 10); run; ods graphics / attrpriority=color; |
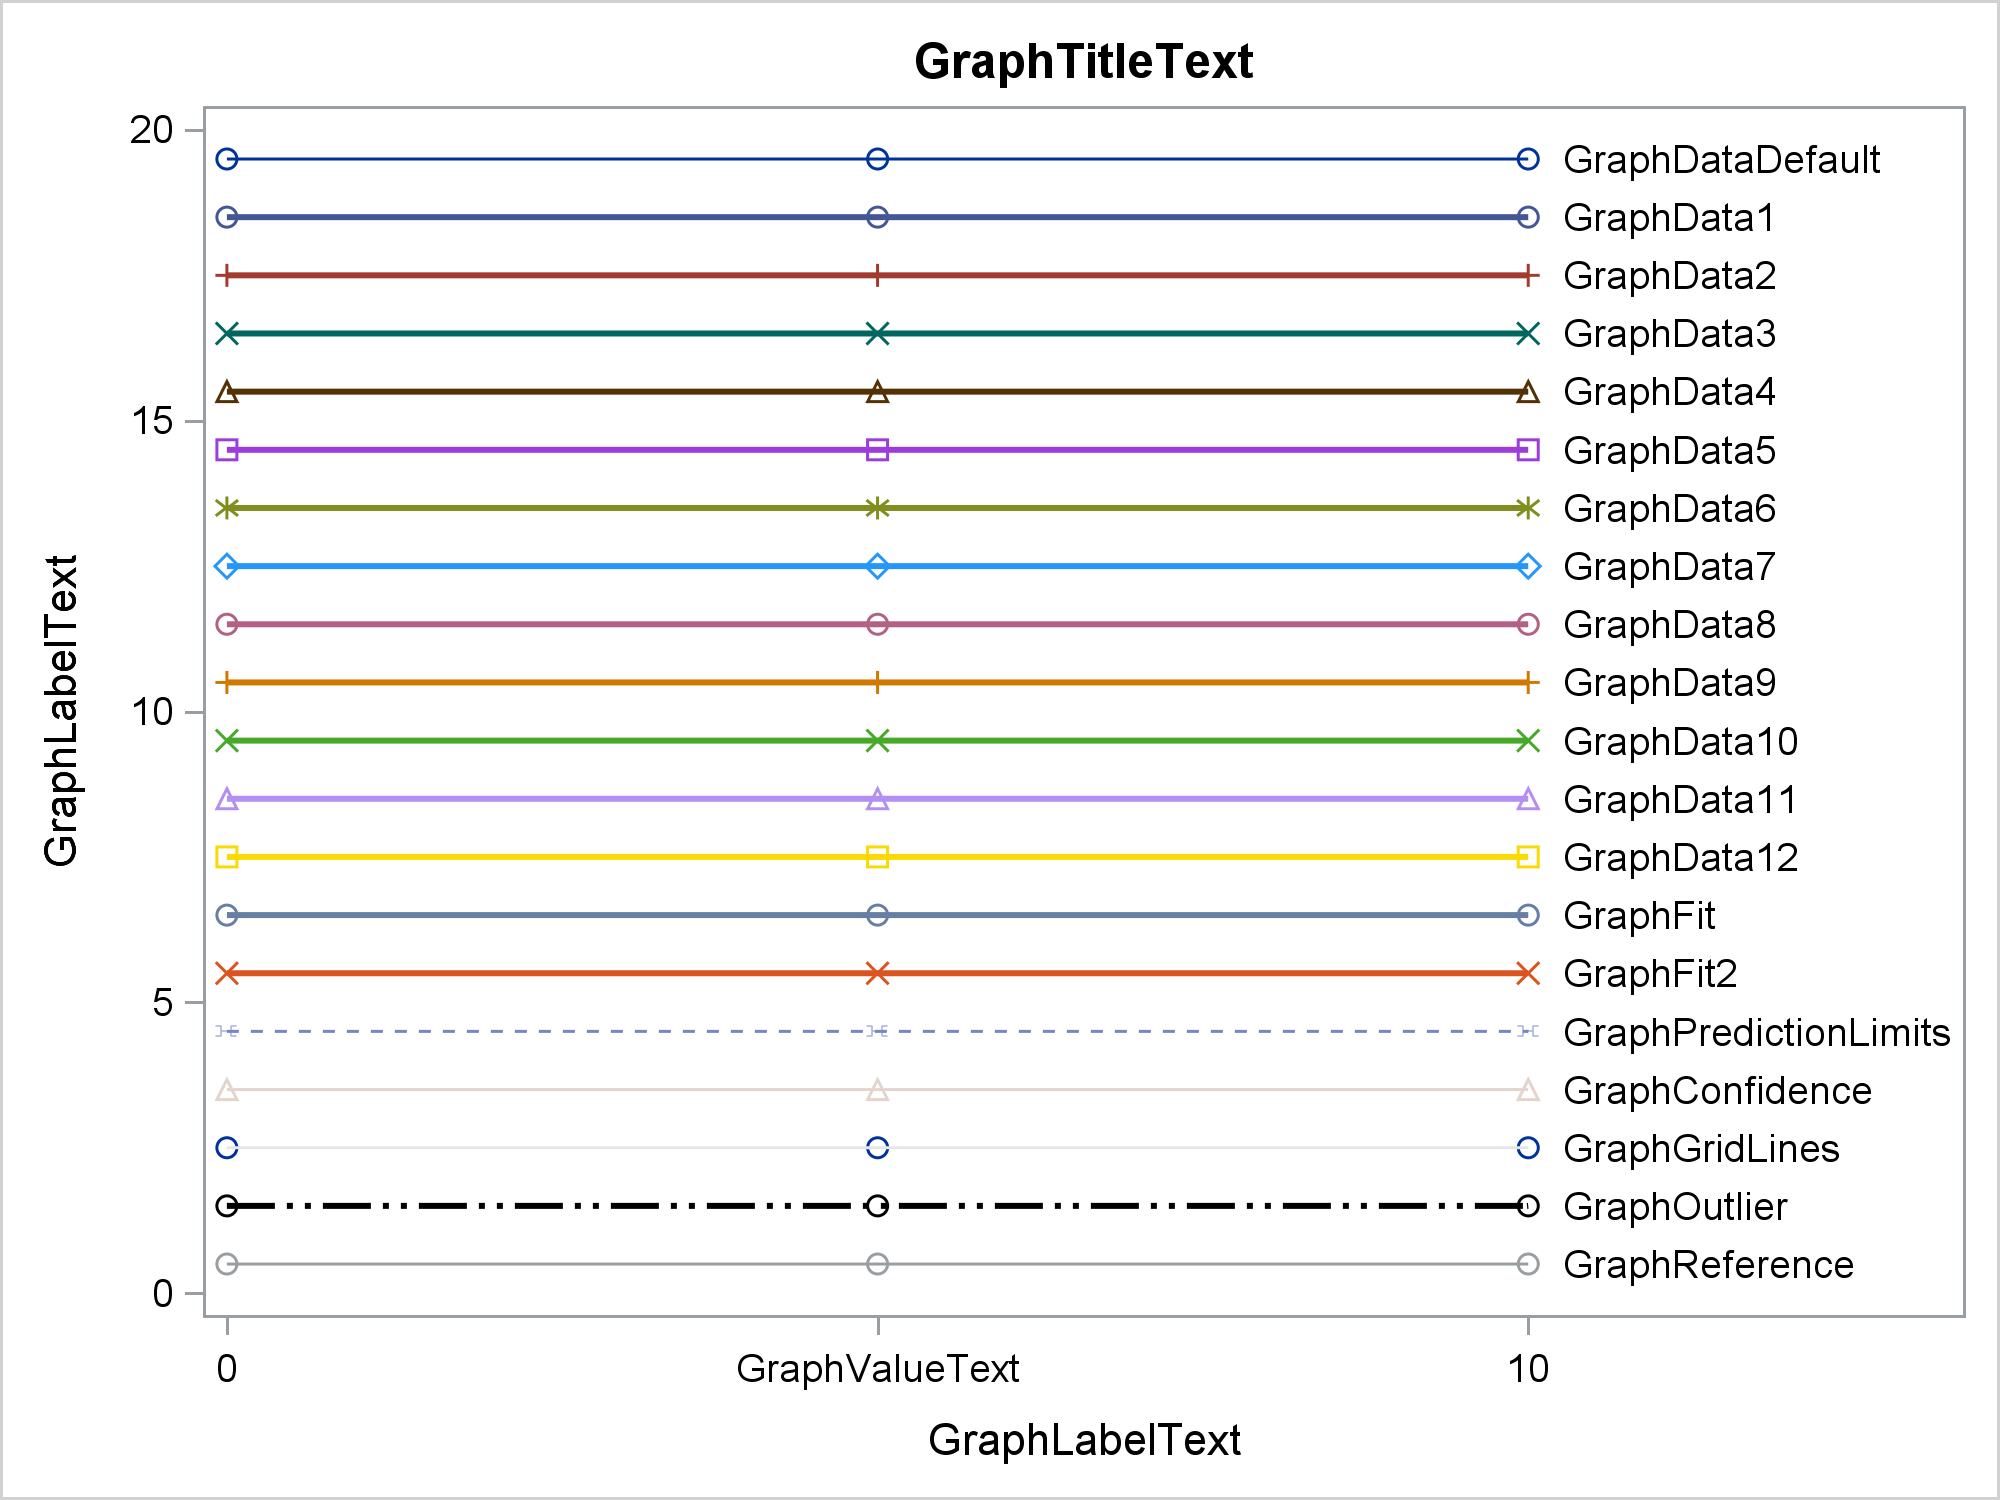
This is often my preference for grouped data, but ODS Graphics provides you with flexible alternatives. Notice that while the group lines are all solid, other lines are not. The STYLEATTRS statement only overrides how groups of observations are displayed.
The following steps display the attribute priority in the SAS log for all of the styles. They examine each style and their parent styles and display the first line that defines an attribute priority (or the default attrpriority = "none" when no attribute priority is defined). You will never find all of the attribute priorities in the documentation. If you have a question about templates, you can directly query the templates to find the answer.
proc template;
   ods exclude stats;
   ods output stats=styles;
   list styles;
quit;

options nonotes nosource;
data _null_;
   set styles(where=(type='Style'));
   call execute(catx(' ', 'proc template; source',  path, ' / expand file="t"; quit;'));
   call execute('data _null_;
                infile "t" end=eof;
                input;
                _infile_ = compress(lowcase(left(_infile_)), ";");
                retain p 1;
                if p and find(_infile_, "define style") then do; p = 0; put / _infile_; end;
                if find(_infile_, "attrpriority") then do; put +3 _infile_; stop; end;
                if eof then put +3 "attrpriority = ""none"""; run;');
run;
options notes source; |
Come by and see me at the Midwest SAS User's Group meeting in Indianapolis from September 30 to October 2, 2018. I will be presenting a tutorial, Advanced ODS Graphics Examples in SAS; a paper, Keeping Up to Date with ODS Graphics; and two super demos, Highly Customized Graphs Using ODS Graphics and Heat Maps: Graphically Displaying Big Data and Small Tables.


4 Comments
Very nice. Helpful
Thanks. This is useful.
.
Had you thought about adding code snippets to the documentation to do this? Hunting around in blogs for things missing from the documentation is not ideal. Now SAS is prioritising online delivery of documentation this would be a nice way to see some benefit from online: quick improvements between versions.
Thanks, Peter! In fact I have put information in our documentation about style comparisons (although not precisely the same information as the post), and one of my goals was to point people to that information. I must say that I rarely hunt around in any particular medium for information about SAS. I find that a Google search that begins with "SAS 9.4" usually does a pretty good job. Sometimes I find the information in documentation. Sometimes I find the answer in SAS Communities. Sometimes I find it in blogs. Sometimes I find it in conference papers. There are so many sources of information out there now, that I would not limit my search to one unless I knew the answer was in a particular place, and I can remember where it is, I just can't remember what it is.
Similar to something I cobbled together for SAS 9.2.3 though I like your inclusion of the GRAPHDATAX labels better.
I included a short proc print to demonstrate the text appearance and a bar chart along with the series plot, and as HTML, PDF and RTF output.
Rerunning the program in a new SAS install is one of the first things I do to see the actual appearance affect of new, or changed, ODS Styles.