I had a nice visit this week to the MWSUG conference in Indianapolis! Everyone was friendly, and I had good attendance at my four talks on ODS Graphics.
I was asked a question that piqued my interest. I was asked if it is possible to build a graph from multiple data sets of potentially different sizes. My first response was no. You have to merge the data first, because PROC SGPLOT has no mechanism to accept multiple DATA= data sets. Then I was asked if it is possible to create the graph in layers--by using multiple calls to PROC SGPLOT. The answer is yes, it is possible, but I still think it is easier and better to merge the data first. Still, I thought this would be a fun topic to explore in Graphically Speaking in case someone out there has a use case for it.
Incidentally, as a SAS/STAT developer, my colleagues and I do produce graphs from multiple data objects. In PROC PRINQUAL, I create a data object that contains the principal component scores and another that contains the scaled eigenvectors. I pass pointers to both to ODS Graphics. The two data objects typically have different sizes. ODS Graphics can process them as if they had been merged into a single data object. To see this, submit the following steps and examine the graph and the ODS output data set.
ods graphics on; proc prinqual data=sashelp.iris mdpref; ods output MDPrefPlot=m; var identity(pet: sep:); id species; format species $2.; run; proc print data=m; run; |
Here is the strategy for creating graphs in layers. Sanjay outlined the strategy in his post Image backgrounds, although his context was different. You can make a graph and save it in a PNG file. Then you can make an SG annotation data set that displays that graph in the background. Then you can run PROC SGPLOT again, bringing in the old graph in the background and adding to it. The trick is, you must ensure that both graphs are the same size and occupy the same region of the overall graph space.
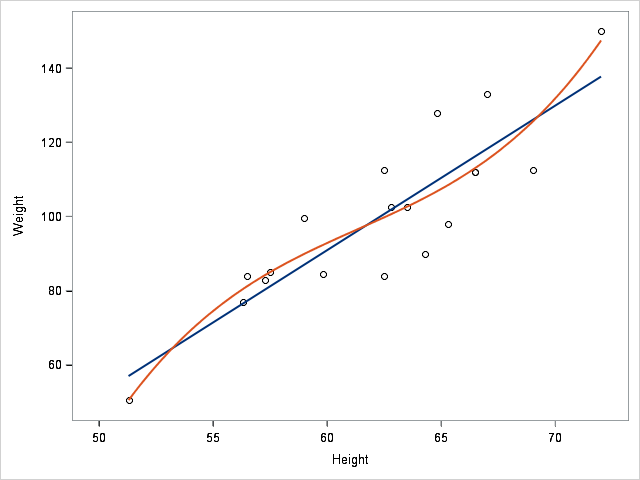
In my first attempt, I thought it would be easiest to use the same data set in each of three graphs. Later, I will suppress displaying the axes three times. For now, I want to see the axes to ensure that they are indeed right on top of each other.
The first plotting statement is the primary statement, and the axes are based on it. I began each step by using the same invisible scatter plot and the same offsets to make the graphs the same size. I also suppress all legends. Invisible scatter plots are often helpful when you want a plotting statement to provide the ranges for the axes without actually displaying anything in the graph.
ods html;
ods _all_ close;
ods html path="C:\Users\saswfk\Desktop\Blog";
ods graphics on / reset=index imagename="PlotA";

%let o = offsetmin=0.05 offsetmax=0.05;
proc sgplot data=sashelp.class noautolegend nocycleattrs;
   scatter y=weight x=height / markerattrs=(size=0);
   scatter y=weight x=height;
   xaxis &o;
   yaxis &o;
run;

data anno;
   retain Function 'Image' Height Width 100
           DrawSpace 'GraphPercent' Image 'PlotA.png' Layer 'Back';
run;

ods graphics on / reset=index imagename="PlotB";

proc sgplot data=sashelp.class noautolegend nocycleattrs nowall sganno=anno;
   scatter y=weight x=height / markerattrs=(size=0);
   reg y=weight x=height / nomarkers;
   xaxis &o;
   yaxis &o;
run;

data anno2;
   set anno;
   image = 'PlotB.png';
run;

ods graphics on / reset=index imagename="PlotFirst";

proc sgplot data=sashelp.class noautolegend nocycleattrs nowall sganno=anno2;
   scatter y=weight x=height / markerattrs=(size=0);
   reg y=weight x=height / nomarkers degree=3 lineattrs=GraphFit2;
   xaxis &o;
   yaxis &o;
run; |
This is the last of the three graphs.
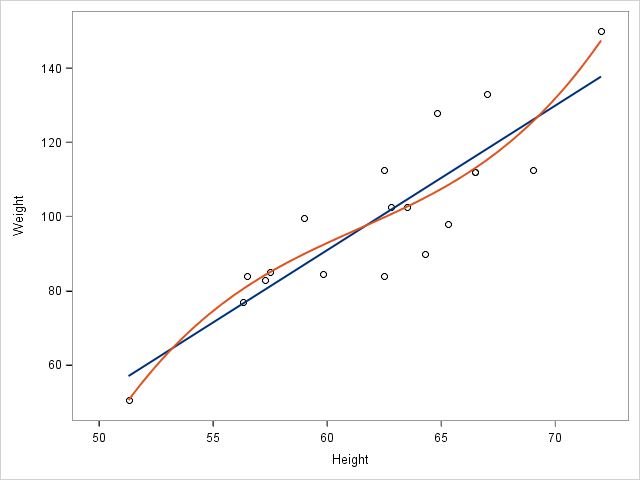
Starting again, you can set the colors of the axis labels and tick values to white in the first two graphs.
ods graphics on / reset=index imagename="PlotC";

%let o = offsetmin=0.05 offsetmax=0.05;
%let i = attrs=(color=white);
%let i = label&i value&i;
proc sgplot data=sashelp.class noautolegend nocycleattrs;
   scatter y=weight x=height / markerattrs=(size=0);
   scatter y=weight x=height;
   xaxis &o &i;
   yaxis &o &i;
run;

data anno;
   retain Function 'Image' Height Width 100
           DrawSpace 'GraphPercent' Image 'PlotC.png' Layer 'Back';
run;

ods graphics on / reset=index imagename="PlotD";

proc sgplot data=sashelp.class noautolegend nocycleattrs nowall sganno=anno;
   scatter y=weight x=height / markerattrs=(size=0);
   reg y=weight x=height / nomarkers;
   xaxis &o &i;
   yaxis &o &i;
run;

data anno2;
   set anno;
   image = 'PlotD.png';
run;

ods graphics on / reset=index imagename="PlotSecond";

proc sgplot data=sashelp.class noautolegend nocycleattrs nowall sganno=anno2;
   scatter y=weight x=height / markerattrs=(size=0);
   reg y=weight x=height / nomarkers degree=3 lineattrs=GraphFit2;
   xaxis &o;
   yaxis &o;
run; |
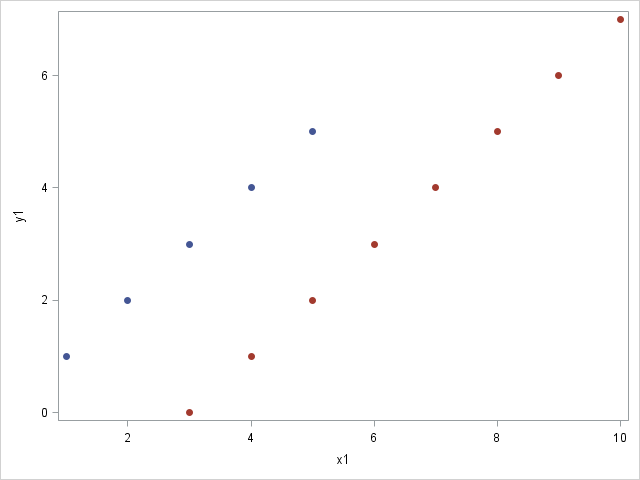
The next example creates two data sets that are different sizes.
data one;
   do x1 = 1 to 5;
      y1 = x1;
      output;
   end;
run;

data two;
   do x2 = 3 to 10;
      y2 = x2 - 3;
      output;
   end;
run; |
Typically, you should merge the data before running PROC SGPLOT.
data both; merge one two; run; proc print; run; ods graphics on / reset=index imagename="PlotThird"; proc sgplot data=both noautolegend; styleattrs datasymbols=(circlefilled squarefilled); scatter y=y1 x=x1; scatter y=y2 x=x2; xaxis; yaxis; run; |
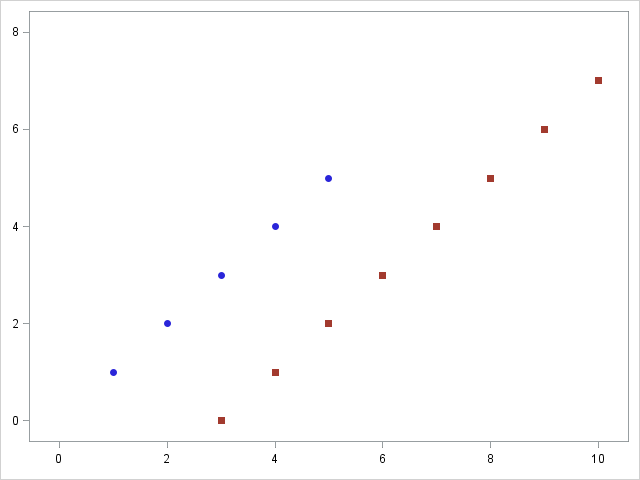
You can instead create the graph in layers. In this case, I control the graph size by specifying the same tick values in both graphs.
ods graphics on / reset=index imagename="PlotE"; proc sgplot data=one noautolegend; scatter y=y1 x=x1 / markerattrs=GraphData1(symbol=CircleFilled); xaxis &o &i display=(nolabel) values=(0 to 10 by 2); yaxis &o &i display=(nolabel) values=(0 to 8 by 2); run; data anno3; set anno; image = 'PlotE.png'; run; ods graphics on / reset=index imagename="PlotFourth"; proc sgplot data=two noautolegend nowall sganno=anno3; scatter y=y2 x=x2 / markerattrs=GraphData2(symbol=SquareFilled); xaxis &o display=(nolabel) values=(0 to 10 by 2); yaxis &o display=(nolabel) values=(0 to 8 by 2); run; |
While you might never want to do precisely this, building graphs at least in part from images is handy, and it is easy to do using SG annotation. You can see another type of example in Inserting a graph into a graph.
Again, for the use case described here, building a graph in layers, I would recommend merging the data and then using PROC SGPLOT in the normal way. Still, this post does show a number of useful techniques including invisible plots, axis options, simple SG annotation using images, and saving PNG files.


1 Comment
Mind blown. Very cool. Thanks.