As many of the regular readers of this blog know, SGPLOT and GTL, provide extensive tools to build complex graphs by layering plot statements together. These plots work with axes, legends and attribute maps to create graphs that can scale easily to different data.
There are, however, many instances where we want to call the attention of the reader to some aspect of the graph, or add some visual element that is not directly connected to the data. In such cases annotation is very useful as shown in the example below. I would hasten to add that, in general, usage of image backgrounds is not recommended as it may distract from the message in the data.
In the example below, a user wanted to add an image background to the graph. The best way to do that is to add the image as an "Image" annotation behind the graph. Annotations can either be layered on top of the plot layers or behind the graph. If placed behind the graph, it is important to turn off the wall fill background so the image will show through. The annotation data set is shown below.
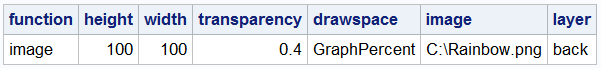
Note the "Layer" value is "Back", and we have set transparency=0.4 to soften the image colors. The image used here is relatively small, so it will be scaled to fill the graph region and become fuzzy automatically. In this case, this is a good thing. The SGPLOT program is shown below. Title is updated.
ods escapechar '~'; title "Average Monthly Temperature (~{Unicode '00b0'x}F)"; proc sgplot data=weather nowall noborder sganno=annoImage pad=0; format mean temp.; styleattrs datacolors=('lightblue' 'yellow' 'orange' 'red'); highlow x=month low=low high=high / type=bar group=mean name='h' lineattrs=graphoutlines dataskin=matte fillattrs=(transparency=0); xaxis display=(nolabel noline noticks); yaxis display=(nolabel noline noticks) grid offsetmax=0.1; keylegend 'h' / noopaque noborder fillheight=14 fillaspect=golden; run; |
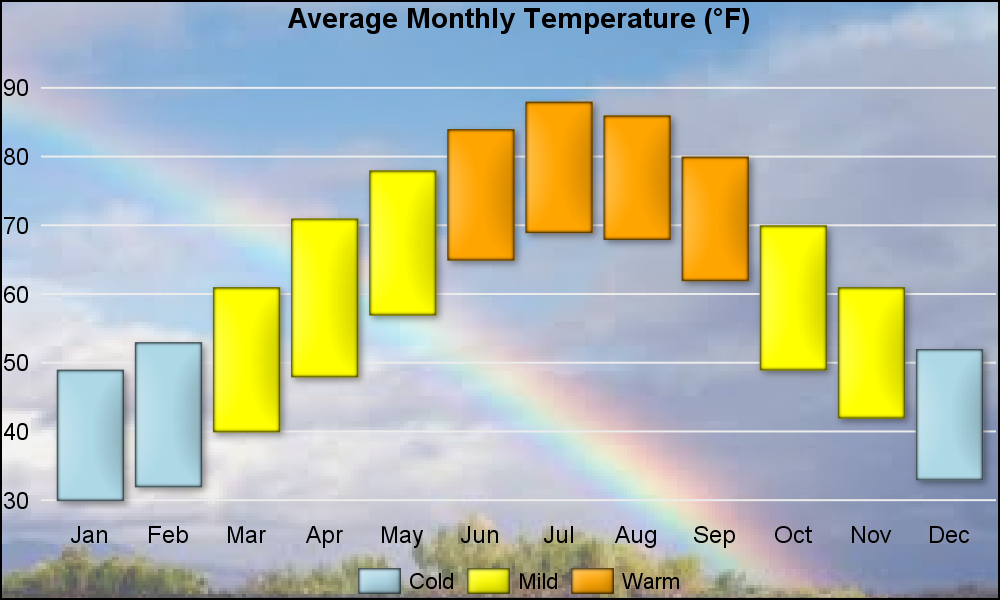
Note the use of FILLHEIGHT and FILLASPECT in the KEYLEGEND statement. These options can be used to control the size of the color swatches in the legend.
My hope is the image background does not distract too much from the information in the data, and maybe adds some appropriate visual interest to the graphic. One could make the background softer by increasing the transparency. The code expects the image in the C:\ folder.
SGPLOT Code: Weather_Image

2 Comments
Pingback: Basic ODS Graphics: Axis Options - Graphically Speaking
Pingback: Basic ODS Graphics: Axis Options - Graphically Speaking