Last year, I wrote almost 90 articles for The DO Loop blog. My most popular articles were about SAS programming, data visualization, statistics and data analysis, and matrix computations. If you missed these articles when I published them—or if you want to read them again!— here is the "Reader's Choice Awards" for some of the most popular articles from 2022:
SAS programming

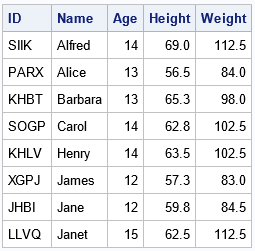
- Random IDs for subjects: In clinical trials, you want to assign each patient a unique ID to preserve the patients' privacy. Although the easiest solution is to assign each patient a number (such as 5631), some researchers prefer a random-looking four-digit sequence of letters (such as VXSW). This article shows how to use SAS to assign a random string value to subjects in an experiment. Be warned: This article contains four-letter words!
- Randomly assign subjects to groups: Did you know that you can use PROC SURVEYSELECT to randomly assign subjects to groups? Now you do! An important application is randomly assigning patients to cohorts (Placebo, Treatment A, Treatment B,...) in a clinical trial.
- Find the smallest or largest data values: This article shows how to use SAS to display the k smallest or k largest data values. Optionally, you can choose the k smallest/largest UNIQUE data values.
Data visualization

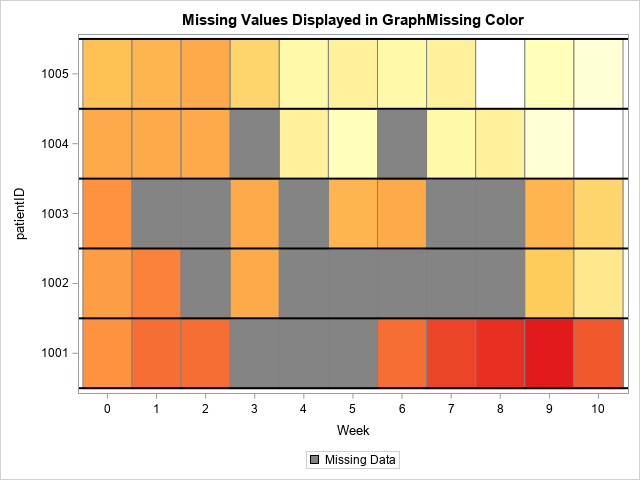
- Visualize missing values in longitudinal data: The traditional spaghetti plot does not do a good job of visualizing missing values. A heat map (sometimes called a lasagna plot) is a better choice for showing missing values among subjects in a longitudinal study.
- Indicate missing values on a time series plot: This trick shows how to create a graph that shows missing values in a time series.
- Order bars in a bar chart: There are three ways to order bars in a bar chart: alphabetically by category, by frequency, or by specifying the order of the categories manually. Learn how to specify each case in PROC SGPLOT.
Statistics and data analysis

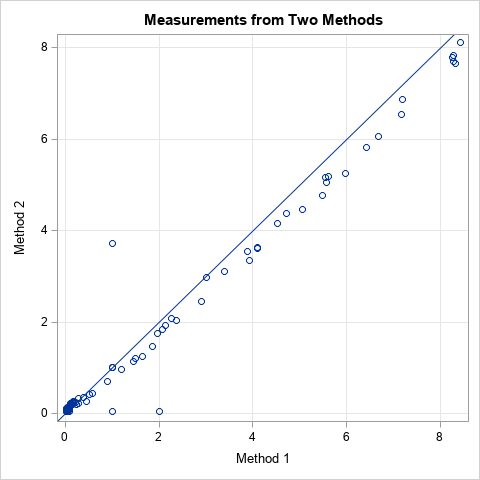
- Passing-Bablock regression: This article provides SAS IML modules that perform Passing-Bablock regression in SAS. This is a regression technique in which the measurements of two variables (X and Y) are both measured with errors, which means that the data do not satisfy the assumptions for ordinary least-squares regression.
- The McNemar test: This article shows how to perform the McNemar test and the exact McNemar test in SAS. It discusses a variation in the test that you might see in other software. McNemar's test is used to assess whether the proportion of subjects who have some attribute (for example, pain) before a treatment is different from the proportion after the treatment.
- Bartlett's sphericity test: This article shows how to perform Bartlett's test for correlation on multivariate data to determine whether it is possible to reduce the dimensionality of the data by using a principal component analysis or a common factor analysis.
Matrix Computations

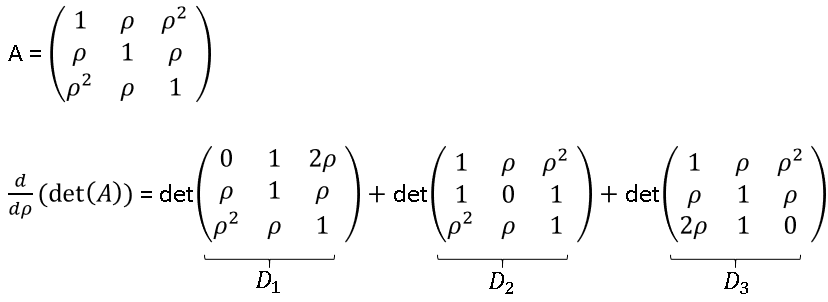
Surprisingly, my most popular blog post from 2022 was an article about how to compute the derivative of the determinant of a matrix. I write about matrix computations regularly, but, for obvious reasons, these articles tend not to be as popular as articles about SAS programming and data visualization.
The determinant indicates whether a linear transformation expands or contracts volume. The derivative of the determinant indicates the rate of change in the determinant as a parameter is varied. I did not previously know how to compute the derivative of a determinant, so I was excited to write about a fairly simple algorithm that gives the derivative. The article demonstrates a rowwise method to compute the derivative of the determinant as the sum of auxiliary matrices and provides examples.
Summary
Many of us make New Year resolutions. My annual resolution is to learn something new every week. If you want to learn something new in the New Year, read (or re-read!) these 10 popular articles from 2022. If you like what you read, consider subscribing to The DO Loop blog.
