What is McNemar's test? How do you run the McNemar test in SAS? Why might other statistical software report a value for McNemar's test that is different from the SAS value? SAS supports an exact version of the McNemar test, but when should you use it? This article answers these questions about McNemar's test in SAS.
The McNemar test
The McNemar test (also called McNemar's test) is a way to test whether the off-diagonal elements in a 2 x 2 frequency table are significantly different. The data are assumed to be matched-pairs data, which means that they represent the responses of one set of subjects measured before and after a treatment or intervention. Situations in which you could use McNemar's test include the following:
- Students are given a test to assess whether they can read at grade level. They go through an enrichment program and are tested again.
- Patients are asked whether they are feeling pain. They are given a treatment and are asked about pain again.
In both examples, the same subjects are tested twice. You can use the McNemar test can assess whether there is evidence that the proportion of negative results (not reading at grade level, not feeling pain) is different after the intervention as compared to before the intervention.
Let's use some educational data. A total of 68 students were given a test before and after an eight-week enrichment program (DeMars, 2015). On the pre-test, 51 students failed and 17 passed. On the post-test, 41 students failed and 27 passed. The following 2 x 2 table shows the counts of students who failed both tests, passed one but failed the other, or passed both tests:
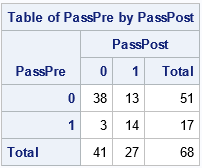
McNemar's test determines whether the off-diagonal elements (3 and 13) are significantly different. Equivalently, whether their difference is significantly different from 0. In general, for a 2 x 2 table such as
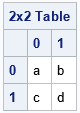
the null hypothesis for McNemar's test is that the intervention has no effect, which means that the probabilities for the cells b and c are equal.
McNemar's test in SAS
You can use the AGREE option on the TABLES statement in PROC FREQ to run the McNemar test in SAS. The test statistic is the quantity M = (b - c)2 / (b + c). When b and c are both large, the statistic is distributed as a chi-squared variable with DF=1 degrees of freedom. The following SAS program defines the data and uses the AGREE option to run the McNemar test on this example:
/* McNemar's test: https://en.wikipedia.org/wiki/McNemar's_test Data from DeMars 2015 https://www.thejuliagroup.com/documents/De_Mars_WUSS2015.pdf */ data Students; input PassPre PassPost Count; datalines; 0 0 38 0 1 13 1 0 3 1 1 14 ; proc freq data=Students; tables PassPre*PassPost / nopercent norow nocol agree; weight Count; ods select CrossTabFreqs McNemarsTest; run; |
Notice how the data are entered. Each row of the input data set represents a group of students of size COUNT. The binary values of the PassPre and PassPost variables indicate whether the students passed (1) or did not pass (0) each test. The WEIGHT statement in PROC FREQ is used to specify the count for each observation possible pair of outcomes. You could also enter the data by using 68 rows, where each row represents a student.
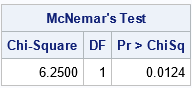
The value of the McNemar statistic is M = (13 - 3)2 / (13 + 3) = 6.25. The p-value is 0.0124, which means that it is unlikely to observe a statistic this large by chance if the intervention has no effect. Think of it this way: if you distribute 16 students at random to the two off-diagonal cells, there is only a small chance that the distribution would be this lopsided (13 vs 3) if the chance of landing in either cell is 50-50. Therefore, you reject that hypothesis and conclude that the intervention had an effect on the students who failed one test and passed the other.
The exact McNemar test
The assumption that McNemar's statistic is chi-square distributed is an asymptotic result for large values of the c and d frequencies. If (b + c) is small (Wikipedia suggests less than 25), then the sampling distribution for the statistic might not follow a chi-square distribution. In that case, you should use an exact test. PROC FREQ supports many exact tests. For the data in this example, the sum of the off-diagonal frequencies is b + c = 16. In PROC FREQ in SAS, you can run an exact test by using the EXACT MCNEM statement, as follows:
proc freq data=Students; tables PassPre*PassPost / nopercent norow nocol agree; weight Count; exact McNem; ods select McNemarsTest; run; |
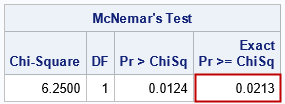
The output shows that the p-value for the exact test is larger than the p-value under the chi-squared assumption.
Why might other software report a different answer?
This article was inspired by a SAS customer who compared the McNemar test in SAS to the results from another software package. The other software reported a different answer. Whenever you compare software, it is important to understand the default settings and the definitions of the statistics. After some research, we discovered that the other software was not giving the result of McNemar's test, but of a variation known as Edwards's correction to McNemar's test. Whereas the test statistic for McNemar's test is M = (b - c)2 / (b + c), Edwards's correction is the statistic M2 = M = (|b - c| - 1)2 / (b + c). Because the M2 statistic subtracts 1 from the numerator, it is always less than McNemar's statistic. Consequently, the associate p-value for Edwards's correction is larger than the p-value for McNemar's statistic.
The formulas for these tests are easily implemented in the SAS DATA step or in the SAS/IML language. The following call to PROC IML computes the statistic and p-values:
/* compute McNemar's chi-square test manually */ proc iml; use Students; read all var {PassPre PassPost Count}; close; DF = 1; Tab = shape(Count, 2, 2); /* make a 2 x 2 table */ B = Tab[1,2]; /* 1st row; 2nd col */ C = Tab[2,1]; /* 2nd row; 1st col */ M = (B-C)**2 / (B+C); /* McNemar test statistic */ M2 = (abs(B-C) - 1)**2 /(B + C); /* Edwards's correction */ pValMc = 1 - cdf("ChiSq", M, DF); /* p-value McNemar */ pValEd = 1 - cdf("ChiSq", M2, DF);/* p-value Edwards */ print (M ||DF ||pValMc)[c={'McNemar' 'DF' 'Pr > ChiSq'} L="McNemar's Test"]; print (M2 ||DF ||pValEd)[c={'Edwards' 'DF' 'Pr > ChiSq'} L="Edwards's Correction"]; |
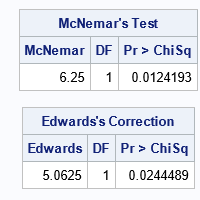
If your software reports a value for McNemar's test that is smaller than the value reported by SAS, it is possible that the software is applying Edwards's correction.
The McNemar test is easy to code manually, and the exact McNemar test is not much harder. Let S = b + c be the sum of the off-diagonal elements. (S=16 in this example.) The null hypothesis is that there is no difference in the proportion of students in the off-diagonal elements. Under this hypothesis, the probability of seeing the value k in one cell and S-k in the other cell is given by the binomial density PDF("Binom", k, 0.5, S). The p-value is the sum of the probabilities for values of k that are more extreme than the observed values. For this problem, it is the sum of the probabilities for k=0, 1, 2, 3, 13, 14, 15, 16.
The sum of a discrete PDF can be computed by using the cumulative distribution (CDF). Because the binomial distribution is symmetric, we only need to compute the CDF for k ≤ 3 (the left tail) and multiply the result by 2 to obtain the probability for the right tail. The following SAS/IML statements implement the exact test:
/* compute McNemar's exact test manually */ S = B + C; /* sum of off-diagonal elements */ k = min(B,C); /* find extreme value */ ExactpVal = 2*cdf("Binomial", k, 0.5, S); result = (M ||DF ||pValMc ||ExactpVal); print result[c={'McNemar' 'DF' 'Pr > ChiSq' 'Exact Pr >= ChiSq'} L="McNemar's Test"]; |
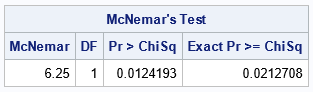
The output confirms the result of the exact p-value from PROC FREQ. Notice that the p-value from Edwards's correction is quite close to the exact p-value.
Summary
This article shows how to perform the McNemar test in SAS. You can get asymptotic and exact p-values. The exact p-value is useful when the sum of the off-diagonal frequencies is less than 25. Be aware that some software might compute a variation of the test that uses Edwards's correction formula. The statistic for Edwards's correction is always less than McNemar's statistic. Although PROC FREQ does not implement Edwards's correction, it is easy to compute manually, as shown in this article.

1 Comment
Thank you Rick!
I would love to read an article about the correspondence between the McNemar's test and the random logistic regression.