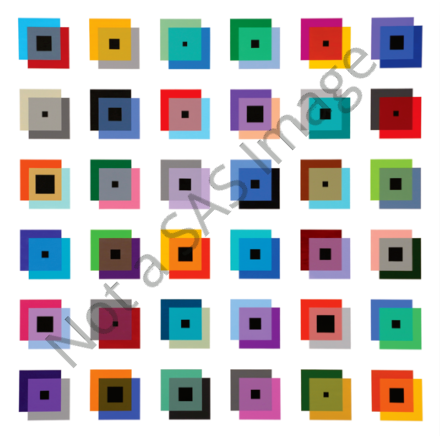
For Christmas 2021, I wrote an article about palettes of Christmas colors, chiefly shades of red, green, silver, and gold. One of my readers joked that she would like to use my custom palette to design her own Christmas wrapping paper! I remembered her jest when I saw some artwork by the artist Angela Johal, who uses geometric shapes in her artwork. The image to the right is Johal's composition "RHYTHM & COLOUR NO. 3." When I saw this work, I thought, "If she had used colors from a Christmas palette, that would make an excellent design for wrapping paper!"
This article uses SAS to create a geometric image that is inspired by Johal's work but uses colors in a palette of Christmas colors. This whimsical task can actually teach us several programming techniques in SAS:
- How to use the POLYGON statement to create display squares and other polygons.
- How to use a discrete attribute map to associate a color with a value of a variable.
- How to use PROC SURVEYSELECT to randomly select a set of foreground and background colors from a data set that defines a palette of colors.
I will break the article into a series of steps that lead us to the final goal. The steps are:
- Create the squares on a 6 x 6 grid. We need 36 colored background squares, 36 semi-transparent colored foreground squares, and 36 small black squares that vary in size.
- Create a discrete attribute map that contains the palette of Christmas colors.
- Randomly assign a color to each of the background and foreground squares. I chose shades of green and brown for the background squares and shades of red, silver, and gold for the foreground squares.
Display a grid of squares
The Johal-inspired image is composed of 36 subimages that are arranged on an evenly spaced 6 x 6 grid. For convenience, place the center of the subimages at the integer lattice points (1,1), (1,2), ..., (6,6). Each subimage consists of three squares:
- A background (BG) square, which is offset slightly to the left and up.
- A foreground (FG) square, which is offset slightly to the right and down. The foreground square is semi-transparent.
- A black square, which is centered but randomly varies in size.
You can use a DATA step to define the centers of the subimages. You can use a second DATA step to offset the background and foreground squares and to vary the size of the centered black squares. Lastly, you can use three POLYGON statements in PROC SGPLOT to display the image. The POLYGON statement requires that each polygon have an ID variable for each vertex in the polygon. This is used to identify which vertices belong to each polygon.
/* Christmas wrapping paper. Inspired by https://johalgeometrics.com/#/rhythm-colour-no-3/ */ /* 1. Generate centers of squares on 6 x 6 grid */ data Squares; length Type $10; do Type = "Background", "Foreground", "Square"; do row = 1 to 6; do col = 1 to 6; output; end; end; end; run; /* 2. create the polygons: each observation (the center) becomes four observations (vertices) */ %let offset = 0.075; %let s = 0.35; data Pattern; call streaminit(123); c = &offset; /* shift the FG and BG squares from center */ s = &s; /* 2*s is the side length for FG and BG squares */ set Squares; PolyID + 1; /* create an ID variable for each polygon (square) */ if type = "Background" then do; /* (bx, by) are vertices of BG square: shift left and up */ bx = col - s - c; by = row - s + c; output; bx = col + s - c; by = row - s + c; output; bx = col + s - c; by = row + s + c; output; bx = col - s - c; by = row + s + c; output; end; else if type = "Foreground" then do; /* (fx, fy) are vertices of FG square: shift right and down */ fx = col - s + c; fy = row - s - c; output; fx = col + s + c; fy = row - s - c; output; fx = col + s + c; fy = row + s - c; output; fx = col - s + c; fy = row + s - c; output; end; else if type = "Square" then do; /* (sx, sy) are vertices of black square, which is centered but is a random size */ w = rand("integer", 16, 40) /100 * s; sx = col - w; sy = row - w; output; sx = col + w; sy = row - w; output; sx = col + w; sy = row + w; output; sx = col - w; sy = row + w; output; end; drop s c w; run; /* POLYGON stmt 1: Squares and colors for background. POLYGON stmt 2: Use transparency for squares in foreground POLYGON stmt 3: Black squares of random sizes */ %let gray = CXF8F8F8; %let black = CX110F0C; title "Christmas Wrapping Paper in the Style of Johal"; title2 "No Colors"; ods graphics / width=480px height=480px; proc sgplot data=Pattern noautolegend noborder; styleattrs backcolor=&gray wallcolor=&gray; polygon x=bx y=by ID=PolyID / fill fillattrs=(color=darkgray); polygon x=fx y=fy ID=PolyID / fill fillattrs=(color=lightgray) transparency=0.3; polygon x=sx y=sy ID=PolyID / fill fillattrs=(color=&black); xaxis display=none offsetmax=0; yaxis display=none thresholdmin=0 thresholdmax=0; run; |
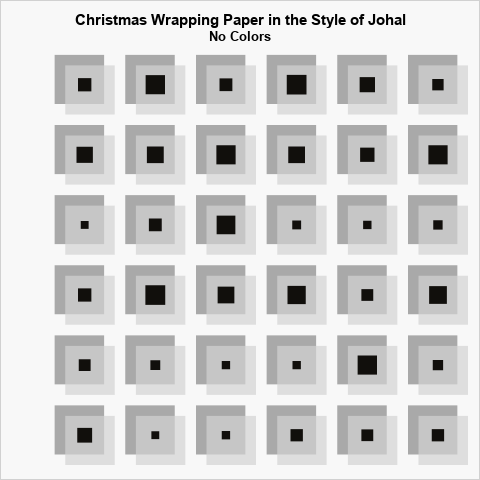
We are off to a good start. The graph shows 36 images on a 6 x 6 grid. The graphic already looks similar to Johal's artwork. In the next section, we will add some color.
Discrete attribute maps
There are 36 x 3 = 108 polygons in the graph, each with its own unique ID. We want to assign colors to the 36 background squares and the 36 foreground squares. (The 36 centered squares will remain black.) Eventually, we will assign the colors randomly, but in this section let's just get ANY Christmas colors into the graphic.
A quick way to add colors is to use the GROUP= options on the POLYGON statement and color each BG and FG polygon by the polygon's ID variable. This will use the colors in the current ODS style to assign colors to the squares. Unfortunately, there is no "Christmas style" that contains colors from a holiday-inspired palette. If we use one of the predefined ODS styles, the squares will be colored with an assortment of blues, purples, and other colors not usually associated with Christmas.
If you are using PROC SGPLOT and want to assign specific colors to specific values of a GROUP= variable, you should define a discrete attribute map. Let's use the 41 colors that I studied last year. We can assign the 17 green and brown colors to the background squares. We can assign the 24 red, yellow, and gold colors to the foreground squares. The following DATA steps define the hexadecimal version of the colors and merge them into one data set:
/* 3. Define colors to use for foreground and background rectangles */ data BGColors; length Color $8; input Color @@; datalines; CX44690D CX698308 CX216A1B CX03744B CX15885A CX1E9965 CX2A5B53 CX5EB69D CX5F1326 CX237249 CX3B885C CX325C39 CX9C9549 CX779645 CX497542 CX274530 CX6E3C3B ; data FGColors; length Color $8; input Color @@; datalines; CXF3C543 CXFFEDC7 CXCA2405 CX9E1007 CXCF1931 CXAD132D CXD9991A CXEAA61E CXF2BC13 CXFBE646 CXFBC34D CXF69F44 CXECEBF1 CXD34250 CXE5D6B5 CXE3CD8E CXDA111E CXC00214 CXDBAA46 CXFFE9D9 CXFF4A4A CXDB2121 CXBF403B CXEDB361 ; /* concatenate the BG and FG colors. Add the Type variable ("Background" or "Foreground"). */ data Colors; length Type $10; set BGColors(in=BG) FGColors; if BG then Type = "Background"; else Type = "Foreground"; ColorID + 1; run; /* Create a discrete data map that maps these colors and ID numbers: https://blogs.sas.com/content/iml/2012/10/17/specify-the-colors-of-groups-in-sas-statistical-graphics.html https://blogs.sas.com/content/iml/2019/07/15/create-discrete-heat-map-sgplot.html */ data ColorAttrMap; /* create discrete attribute map */ keep ID Show Value FillColor MarkerColor; retain ID 'ChristmasColors' /* name of map */ Show 'AttrMap'; /* always show all groups in legend */ set Colors(rename=(ColorID=Value Color=FillColor)); MarkerColor = FillColor; run; proc print data=ColorAttrMap; run; |
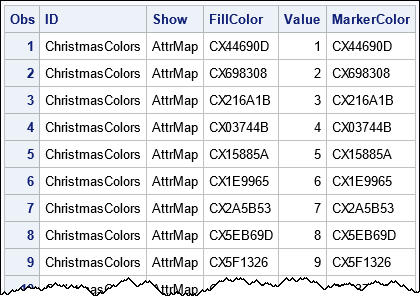
See the documentation for more information about the structure of a discrete attribute map and the name of the variables. This discrete attribute maps associates 41 colors to the values 1–41. If you create a graph that has a GROUP= variable, then the groups for values 1–41 will be assigned colors from the Christmas palette. The following call to PROC SGPLOT displays 41 foreground and background squares and all the black squares:
title "Christmas Wrapping Paper in the Style of Johal"; title2 "Color by Polygon ID"; title3 "Only 41 Squares Are Shown"; proc sgplot data=Pattern noautolegend noborder dattrmap=ColorAttrMap; /* specify discrete attr map */ WHERE PolyID<=41 OR PolyID > 72; /* TEMPORARY TEMPORARY TEMPORARY */ styleattrs backcolor=&gray wallcolor=&gray; polygon x=bx y=by ID=PolyID / group=PolyID fill attrid=ChristmasColors; /* assign colors to PolyID */ polygon x=fx y=fy ID=PolyID / group=PolyID fill transparency=0.3 attrid=ChristmasColors; /* assign colors to PolyID */ polygon x=sx y=sy ID=PolyID / fill fillattrs=(color=&black); xaxis display=none offsetmax=0; yaxis display=none thresholdmin=0 thresholdmax=0; run; |
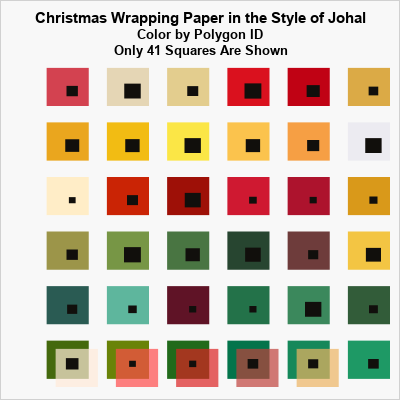
The PolyID variable was used to map colors to squares. Since there are only 41 colors, I've displayed only 41 foreground and background squares. The first 17 background squares (the lower three rows) are shades of green and brown. The remaining squares are shades of red, orange, silver, and gold. Clearly, the discrete attribute map is working.
In the next section, we randomly assign one of the 17 background colors to each of the 36 background squares, and we randomly assign one of the 24 foreground colors to each of the 36 foreground squares.
Random assignment of colors
Any time you need to perform a random assignment, you should consider using the SURVEYSELECT procedure. For this application, you can use the STRATA statement (which is like a BY statement) to apply the selection both to the set of background colors and to the set of foreground colors. You can use the SAMPSIZE=36 option to ensure that 36 colors from each group are selected. Since the number of colors is less than 36, you must use sampling with replacement (METHOD=URS). Lastly, you should use the OUTRANDOM option, which requires SAS 9.5M5 or later, so that the colors are written in a random order. The following calls generate the random colors, merge the colors into the data set that contains the squares, and uses the GROUP=ColorID option to create the final image:
/* 4. Randomly choose 36 foreground and 36 background colors. Use the STRATA statement in PROC SURVEYSELECT to choose 36 random color from each Type ("Foreground" or "Background"). Use OUTRANDOM option to get colors in arbitrary order. Note that the data set must be sorted by the STRATA variable. */ proc surveyselect data=Colors out=RandColors(keep=Color Type ColorID) seed=12345 noprint sampsize=36 method=URS /* select with equal probability and with replacement */ outhits /* one row for each selected unit */ outrandom; /* permute the order of the units (SAS 9.5M5) */ strata Type; run; /* merge these random colors into the polygon data to establish a mapping between the PolyID and the ColorID variables */ data RandomColors; set RandColors; by Type; PolyID + 1; keep Type ColorID PolyID; run; data WrappingPaper; merge Pattern RandomColors; by Type PolyID; run; title "Christmas Wrapping Paper in the Style of Johal"; proc sgplot data=WrappingPaper noautolegend noborder dattrmap=ColorAttrMap; styleattrs backcolor=&gray wallcolor=&gray; polygon x=bx y=by ID=PolyID / group=ColorID fill attrid=ChristmasColors; polygon x=fx y=fy ID=PolyID / group=ColorID fill transparency=0.3 attrid=ChristmasColors; polygon x=sx y=sy ID=PolyID / fill fillattrs=(color=&black); xaxis display=none offsetmax=0; yaxis display=none thresholdmin=0 thresholdmax=0; run; |
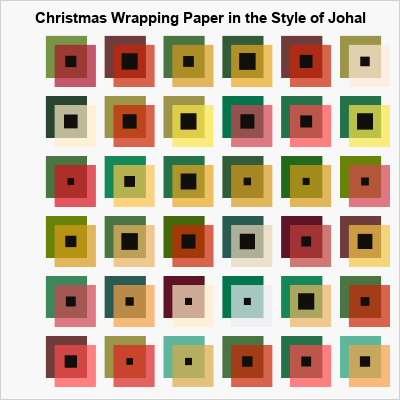
Success! We have used SAS to create a Johal-inspired graphic in which the colors of the foreground and background squares are randomly assigned from a palette of Christmas colors. The background squares are shades of green and brown. The foreground squares are shades of red, gold, and silver. It might not be suitable for an art gallery, but I think it would look very nice on a wrapped present under my Christmas tree!
Summary
This fun article uses SAS to create a design for Christmas "wrapping paper" in the style of artwork by the artist Angela Johal. Although the article is meant to spread Christmas cheer, it also demonstrates a few useful graphical techniques in SAS. It shows an example of how to use the POLYGON statement in PROC SGPLOT, it shows how to create a discrete attribute map to associate user-specified colors with groups, and it shows how to use PROC SURVEYSELECT to randomly select items (with replacement) from a specified set of items.
Think you can do better? Modify my program! You can change the SEED= option on the PROC SURVEYSELECT statement, or you can change the colors used for the foreground or background squares. Have fun!
