SAS SG Procedures do not support creating a 3D Scatter plot, but SAS does provide a mechanism to create any complex 3D plots with existing SG Procedures. In the articles “A 3D Scatter Plot Macro” and A 3D Scatter Plot Animation Macro by Sanjay Matange, a SAS macro to create a 3D Scatter to visualize 3D data was provided. The key tech is to use the ORTHGRAPHIC projection to map 3D data to a unit cube and render data on a 2D plane with SGPLOT Procedure. It requires a 94M1+ SAS environment to run the code.
This article provides an enhanced re-written Macro called %SG3D to visualize 3D data easily in SAS. Currently, it only provides the features like SCATTER statement of PROC G3D but does not support PLOT statement features. The %SG3D macro provides many arguments for data and appearance control, so the user can customize the appearance and graphical elements as they wish. The enhanced part includes the following visualization features:
- Provide 11 Data parameters along with one customizable Attrmap past to control styles.
- Support optional GROUP, SIZE parameter, it invokes BUBBLE statement instead of SCATTER statement once SIZE parameter was specified.
- Provide viewing angle parameters Tilt, Rotate (Pan) and Roll angles control.
- Provide 27 visualization parameters to control appearance of output, including WALL, AXES & RANGES, GRIDS, SHADOW (POINTS/NEEDLES), MARKERS and LEGEND.
- Auto rotate the Axis labels and Range labels on X, Y, Z axis.
- Auto build WALL and Grid data for a given dataset.
- INITDATA parameter can be used to avoid repeated data initialization for multiple invocations for animation generation.
- Add Spacing control to ensure all elements visible without truncation.
- Fix the MIN/MAX calculation bug in data normalize
- Fix the front axis lines were covered by the bubble
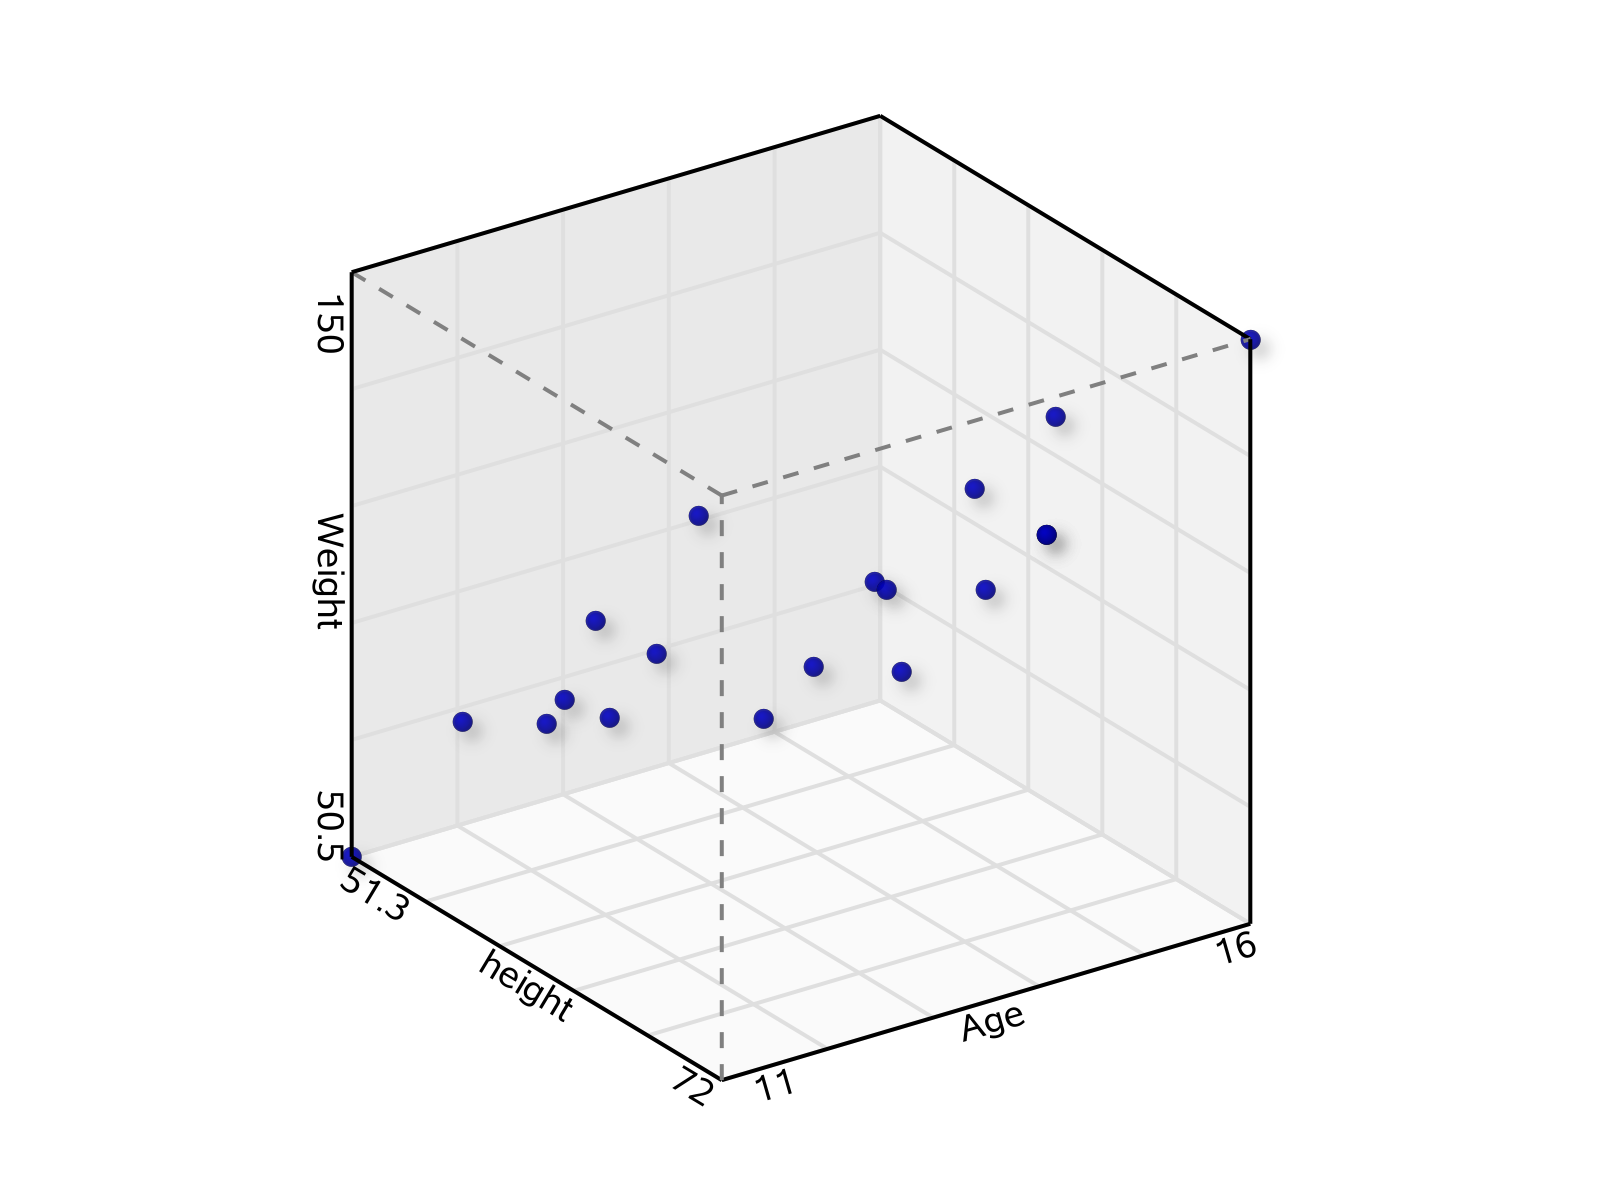
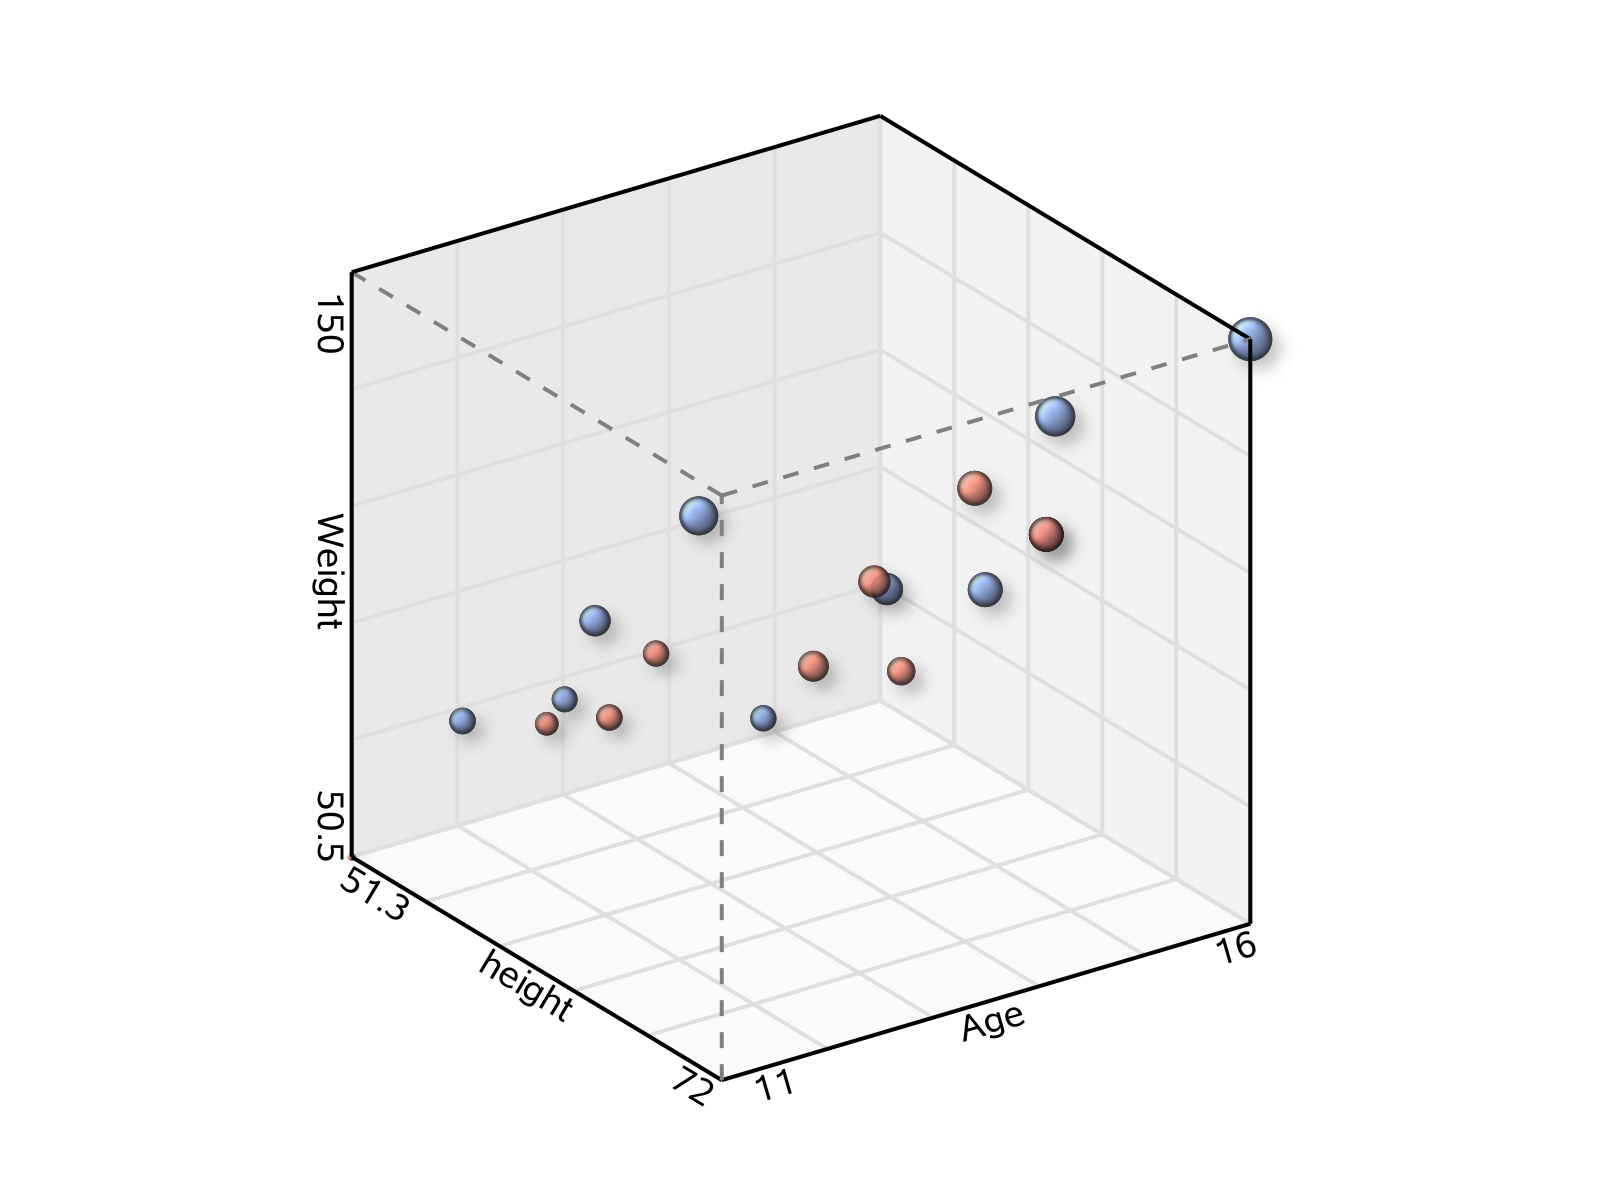
A SAS User can invoke the following code to generate a simple 3D scatter based on the SASHELP.CLASS dataset:
%include 'SG3D_Macro.sas'; options nomautosource nomprint nomlogic ; %let gpath="%sysfunc(getoption(work))"; %let dpi=400; ods html close; ods listing gpath=&gpath image_dpi=&dpi; ods graphics / reset attrpriority=color width=4in height=3in imagename="Class" noborder; /*--A simple 3D scatter--*/ %SG3D (Data=sashelp.class, X=height, Y=Age, Z=Weight ); /*--A simple 3D scatter with GROUP variable specified --*/ %SG3D (Data=sashelp.class, X=height, Y=Age, Z=Weight, Group=Sex); /*--A simple 3D scatter with GROUP and SIZE variable specified --*/ %SG3D (Data=sashelp.class, X=height, Y=Age, Z=Weight, Group=Sex, size=Weight); /*--A simple 3D scatter with GROUP and SIZE variable specified, along with FloorNeedles --*/ %SG3D (Data=sashelp.class, X=height, Y=Age, Z=Weight, Group=Sex, size=Weight, FloorNeedles=1 ); |
The output graphs are listed below (Figure 1), but you can customize the graphic output with any upper parameters you'd like.
 |
 |
 |
 |
Figure 1: 3D Scatter of SASHELP.CLASS
You can create an animation based on the rotation parameter of %SG3D, You can check Figure 2: (Left) shown below for its output:
%macro run_anim_macro(data=sashelp.class, x=height, y=age, z=weight,group=sex, size=Weight, start=, end=, incr=, title=,FloorNeedles=0); %do rotate=&start %to &end %by &incr; %SG3D (Data=&data, X=&x, Y=&y, Z=&z, title=&title, Group=&group, Size=&size, Attrmap=attrmap, Tilt=65, Rotate=&rotate, InitData=%eval(&rotate=&start),FloorNeedles=&FloorNeedles); %end; %mend run_anim_macro; options nomautosource nomprint nomlogic; ods html close; ods listing gpath=&gpath image_dpi=&dpi; /*--Create GIF animation--*/ options papersize=('5 in', '4 in') printerpath=gif animation=start animduration=0.04 animloop=yes noanimoverlay nodate nonumber; ods printer dpi=100 file='C:\Temp\Class3DScatterAnim.gif'; ods listing gpath=&gpath image_dpi=&dpi; ods graphics / reset attrpriority=color width=5in height=4in imagefmt=GIF noborder /*if lost dataskin*/ DATASKINMAX=1000; %run_anim_macro( start=-30, end=-60, incr=-1); %run_anim_macro( start=-60, end=-30, incr= 1); options printerpath=gif animation=stop; ods printer close; |
 |

|
Figure 2: 3D Scatter animation of SASHELP.CLASS (Left) and SASHELP.IRIS (Right)
Accordingly, you can use any 3D data to create 3D scatter animation, e.g. the SASHELP.IRIS dataset. The PetalLength, PetalWidth and SepalLength variables are mapped to X, Y, Z and use Species as the GROUP variable and SepalWidth as thenSIZE variable. You can check Figure 2: (Right) above for its output.
options nomautosource nomprint nomlogic; ods html close; ods listing gpath=&gpath image_dpi=&dpi; /*--Create GIF animation--*/ options papersize=('5 in', '4 in') printerpath=gif animation=start animduration=0.04 animloop=yes noanimoverlay nodate nonumber; ods printer dpi=100 file='C:\Temp\Iris3DScatterAnim.gif'; ods listing gpath=&gpath image_dpi=&dpi; ods graphics / reset attrpriority=color width=5in height=4in imagefmt=GIF noborder /*if lost dataskin*/ DATASKINMAX=1000; %run_anim_macro(data=sashelp.iris, x=PetalLength,y =PetalWidth, z=SepalLength, size=SepalWidth, group=Species, start=-30, end=-60, incr=-1,FloorNeedles=1); %run_anim_macro(data=sashelp.iris, x=PetalLength,y =PetalWidth, z=SepalLength, size=SepalWidth, group=Species, start=-60, end=-30, incr= 1,FloorNeedles=1); options printerpath=gif animation=stop; ods printer close; |
In fact, SAS SGPLOT already provides the necessary graphical elements for complex visualization. 3D or high-dimensional data can be easily visualized after being projected appropriately. With SAS' strong support for animation features, SAS users can create complicated 3D or high dimension visualizations quickly. The animation for the three-body problem in the post "Considerations for generating time-accurate animation with SAS" was also generated by the SAS SGPLOT Procedure.
3D Scatter Macro: SG3D_Macro
