In the previous article, I described the process to create a 3D Scatter Plot using a 3D Orthographic View matrix and the SGPLOT procedure. I posted a macro that can be used to create a 3D scatter plot from any SAS data set, using 3 numeric columns, one each for X, Y and Z (Response) axes.
Visualization of 3D data can be improved by providing interaction or animation. Here I have described a way to create an animation using the idea described in the previous article.
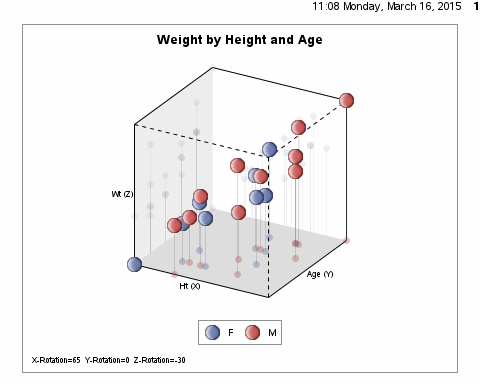
The setup for the animation is as follows:
options papersize=('5 in', '4 in') printerpath=gif animation=start animduration=0.05 animloop=yes noanimoverlay; ods printer dpi=100 file='C:\Class3DScatterAnim.gif'; ods listing image_dpi=200; ods graphics / reset attrpriority=color width=5in height=4in imagefmt=GIF; %run_anim_macro(data=sashelp.class, start=-30, end=-60, incr=-1); %run_anim_macro(data=sashelp.class, start=-60, end=-30, incr=1); options printerpath=gif animation=stop; ods printer close; |
I have modified the %Ortho3D_Macro provided in the previous article, and added a loop to render multiple graphs with changing value for the Z-Rotation from -30 to -60 and back by 1 degree. Here I have created a GIF animation. An SVG animation can also be created using the code at the bottom of the attached file.
3D Animation Macro: Ortho_3D_Animation
Matrix Multiplication Function: Matrix_Functions


8 Comments
Great tool!
I noticed that the dashed gridlines are covered by the bubbles. Is this intentional?
Al
You can change the order of drawing the various parts in the program to draw the bounding box last.
I notice there is also an optical "illusion". Several balloons between about1/3 and 1/2 of the age axis can appear to go outside of the plot area if you watch the dashed vertical axis as it moves.
And the Wt label gets trimmed occasionally as if outside the display area.
Where do you specify color?
Color for the markers comes from the GROUP role.
This is really great thing for 3d animator. Thanks for sharing the article.
I really appreciate this post. I have been looking everywhere for good sites for animation. Thanks for sharing the article.
Is it possible to update this macro for sas studio 9.4?
Currently this below occurs when you run the macro (copied and pasted from the 3D Animation Macro: Ortho_3D_Animation link into a new program in sas studio and run)
ERROR 251-185: The subroutine MATMULT is unknown, or cannot be accessed. Check your spelling.
Either it was not found in the path(s) of executable images, or there was incorrect or missing subroutine descriptor
information.