The SG Procedures do not support creating a 3D scatter plot. GTL has some support for 3D graphs, including a 3D Bi-variate Histogram and a 3D Surface, but still no 3D point cloud. The lack of such a feature is not due to any difficulty in doing this as GTL already support the LAYOUT OVERLAY3D container, but the fact that there was no one urgently requesting such a feature.
However, often we do have a need for visualization of 3D data, and it would be nice to be able to do this. So, here I have presented a macro that uses the features of the SGPLOT procedure to display 3D data. This uses SAS 9.4 features to render the walls, axis labels and the filled "spherical-looking" markers.
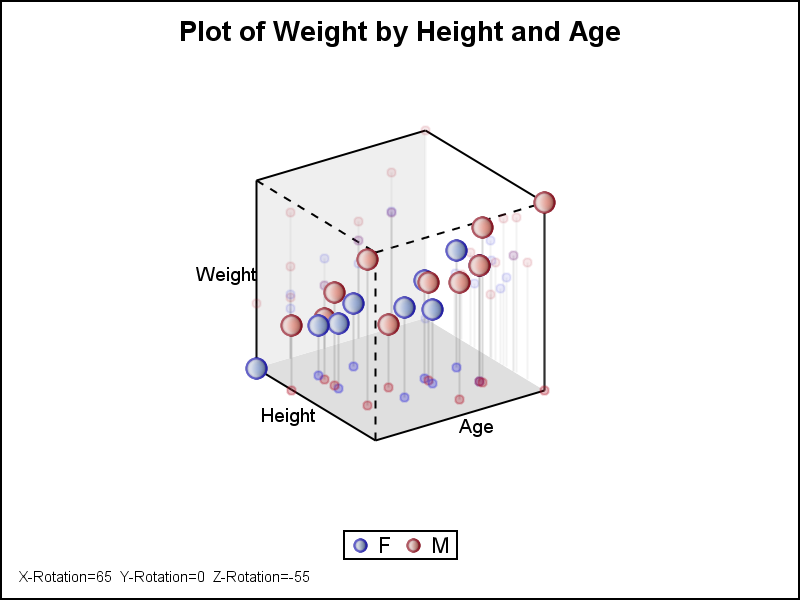
%Ortho3D_Macro (Data=sashelp.class, WallData=wall_Axes, X=height, Y=Age, Z=Weight, Lblx=Height, Lbly=Age, Lblz=Weight, Group=Sex, Attrmap=attrmap, Tilt=65, Rotate=-55, Title=Plot of Weight by Height and Age); |
Note the following items in the macro invocation above:
- The data set to be viewed is provided.
- A data set defining the 3D walls is provided. This is shown in detail in the program code.
- The three columns to be mapped to each axis are provided.
- X and Y form the two independent variables, and the response variable is displayed on the vertical Z axis.
- Labels for each axis can be specified.
- An Attribute map is used to set the visual attributes of the walls and bounding box of the data. This is shown in the code.
- A group variable can be used to color the markers.
- Viewing parameters Tilt (0 to 90) and Rotate (-15 to -75) are ideal.
- Title can be set.
The macro maps the 3D data to a unit cube, and projects the data into the view space using an ORTHOGRAPHIC projection. This avoids distortion of the data that can happen when using a perspective projection.
Here are the features of the graph:
- Spherical looking markers are drawn at each (x, y, z) location.
- Axis labels are drawn, but not the tick values. That could be added, but can get messy. The idea is to really see the shape of the data.
- Relative positions of the markers can be a challenge to view in a static 3D view. So, the X-Y, X-Z and Y-Z projections for each point are also displayed to help locate the points in 3D space.
- Needles are dropped to the floor.
- View parameters are displayed.
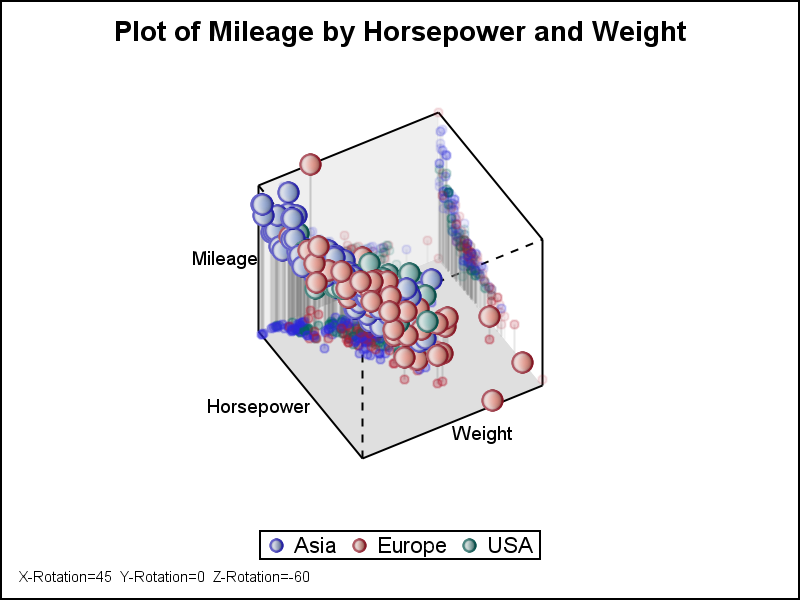
The same macro can be invoked for other data such as all the Sedans in the Cars data as shown below:
%Ortho3D_Macro (Data=sedans, WallData=wall_Axes, X=horsepower, Y=Weight, Z=mpg_city, Lblx=Horsepower, Lbly=Weight, Lblz=Mileage, Group=origin, Attrmap=attrmap, Tilt=45, Rotate=-60, Title=Plot of Mileage by Horsepower and Weight); |
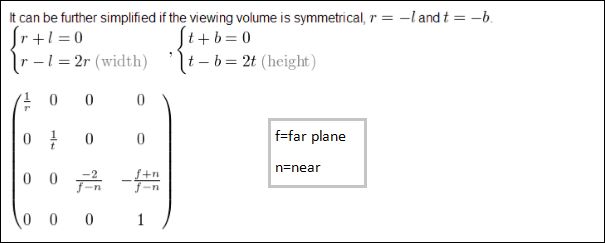
For those interested in the process for projection of 3D data on to a 2D plane, the View Matrix for the Orthographic Projection is shown below.
We can also use the standard way to create an animated GIF or SVG file that helps in the visualization of the data. I will include that in the next post.
Note the macro is provided for illustration purposes on what is possible. I have not rigorously tested all settings and use cases. If visualization of 3D data is something you feel you need, please chime in with your suggestions for more 3D plots right here, or to SAS Technical Support.
Full SAS 9.4 Code: Ortho_3D_Macro_94
Matrix Functions: Matrix_Functions


9 Comments
Pingback: A 3D Scatter Plot Animation Macro
What version of 9.4 are you using? I am using TS1M0 and it will not take the polygon and text statements that follow the proc sgplot statement.
Many thanks for your help.
Polygon plot was added with SAS 9.40M1. Text plot in M2. If you have M0, you can remove the plot statements it does not like from the macro.
Nice job, can run in SAS University Edition?
Pingback: Rotation matrices and 3-D data - The DO Loop
Is that possible to show tick values for X, Y, Z axis?
Hi, I had to change all references from sasuser.funcs to work.funcs to get this to waork as no right for sasuser on the server implementation. Here it is a group opption for color, I have meddled a bit using a continous variable and colorresponse but do not really know how to get thes to work. If possible can somebody please make an example.
Pingback: Using machine learning to improve tumor biopsies - SAS Users
Pingback: A better 3D scatter plot macro - Graphically Speaking