Welcome back to my SAS Users blog series CAS Action! - a series on fundamentals. In my previous part 1 and part 2 posts I reviewed how to use the simple.freq CAS action to generate frequency distributions for one or more columns and how to save the results. In this post I will show you how to group the results of the freq action.
In this example, I will use the CAS language (CASL) to execute the freq CAS action. Be aware, instead of using CASL, I could execute the same action with Python, R and more with some slight changes to the syntax for the specific language. Refer to the documentation for syntax in other languages.
Load the demonstration data into memory
I'll start by executing the loadTable action to load the WARRANTY_CLAIMS_0117.sashdat file from the Samples caslib into memory. By default the Samples caslib should be available in your SAS Viya environment. I'll load the table to the Casuser caslib and then I'll clean up the CAS table by renaming and dropping columns to make the table easier to use. For more information how to rename columns check out my previous post. Lastly I'll execute the fetch action to preview 5 rows.
proc cas; * Specify the input/output CAS table *; casTbl = {name = "WARRANTY_CLAIMS", caslib = "casuser"}; * Load the CAS table into memory *; table.loadtable / path = "WARRANTY_CLAIMS_0117.sashdat", caslib = "samples", casOut = casTbl + {replace=TRUE}; * Rename columns with the labels. Spaces replaced with underscores *; *Store the results of the columnInfo action in a dictionary *; table.columnInfo result=cr / table = casTbl; * Loop over the columnInfo result table and create a list of dictionaries *; listElementCounter = 0; do columnMetadata over cr.ColumnInfo; listElementCounter = listElementCounter + 1; convertColLabel = tranwrd(columnMetadata['Label'],' ','_'); renameColumns[listElementCounter] = {name = columnMetadata['Column'], rename = convertColLabel, label=""}; end; * Rename columns *; keepColumns = {'Campaign_Type', 'Platform','Trim_Level','Make','Model_Year','Engine_Model', 'Vehicle_Assembly_Plant','Claim_Repair_Start_Date', 'Claim_Repair_End_Date'}; table.alterTable / name = casTbl['Name'], caslib = casTbl['caslib'], columns=renameColumns, keep = keepColumns; * Preview CAS table *; table.fetch / table = casTbl, to = 5; quit; |
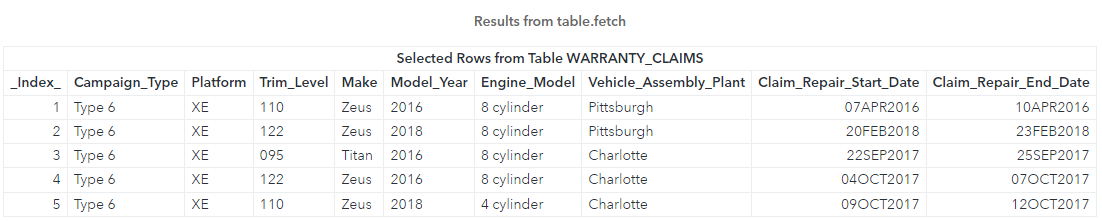
The results above show a preview of the warranty_claims CAS table.
Add a grouping column
What if you want a frequency distribution of each Model_Year by Make? You can easily do that with the freq action. The key is adding the groupBy sub parameter when referencing the CAS table. Then use the grouped CAS table in the freq action and specify the column to analyze. In this example, the CAS table is grouped by Model_Year and the freq action specifies the Make column.
proc cas; * Reference the CAS table and group by Model_Year *; casTbl = {name = "WARRANTY_CLAIMS", caslib = "casuser", groupby = "Model_Year"}; * Model_Year by Make frequency *; simple.freq / table = casTbl, input = 'Make'; quit; |
Partial results
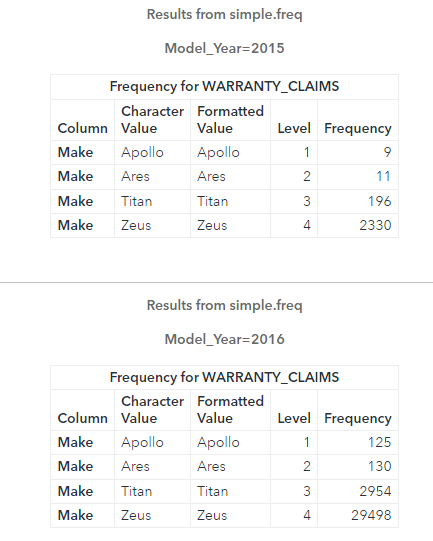
The above results show that the freq action returns a separate table for each distinct Model_Year. While this is great information, what if I want a single table with the Model_Year by Make?
Saving the results as a CAS table
One option is saving the results as a CAS table. This works similarly to my previous post CAS-Action! Saving Frequency Tables - Part 2. Simply add the casOut parameter to the freq action. I'll add a label to the new CAS table to give it a description and then preview the new CAS table with the fetch action.
proc cas; * Reference the CAS table and group by Model_Year *; casTbl = {name = "WARRANTY_CLAIMS", caslib = "casuser", groupby = "Model_Year"}; * Specify the output CAS table information *; outputTbl = {name = "yearByMake", caslib = "casuser"}; * Get a frequency of Model_Year by Make and create a CAS table *; simple.freq / table = casTbl, input = 'Make', casOut = outputTbl || {label = "Year by Make frequency table"}; * Preview the CAS table *; table.fetch / table = outputTbl; quit; |
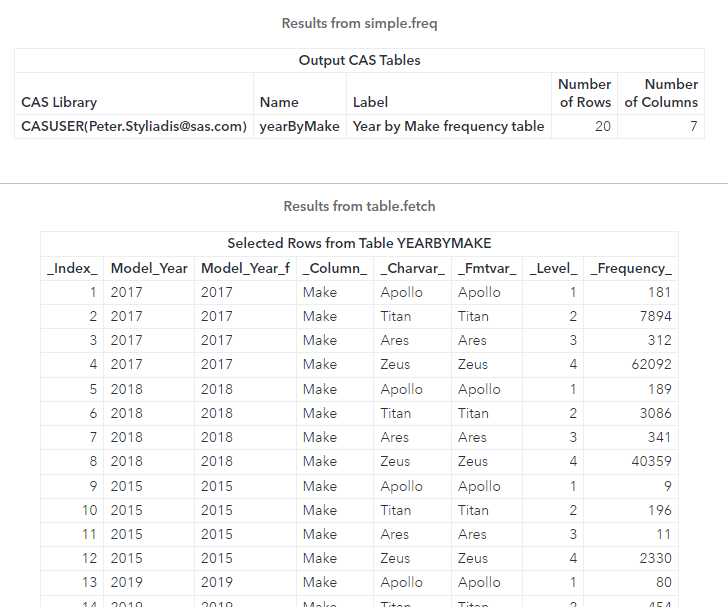
The results above show the freq action with the casOut parameter returns information about the newly created CAS table, and the fetch action returns a preview of the new CAS table. Notice the analysis is grouped by Model_Year and is consolidated into a single table.
Saving the results as a SAS data set
Instead of saving the results back to the CAS server, you can save them as a SAS data set. I did an example in my previous post CAS-Action! Saving Frequency Tables - Part 2. However, when you save the results of an action summarized by groups, you need to combine each individual group into a single result table. To do that you need to use the COMBINE_TABLES function on the dictionary returned from the CAS server. The COMBINE_TABLES function will combine each individual table in a dictionary and return a single result table. Then you can save the new table by using the SAVERESULT statement. Lastly, I'll view the SAS data set using the PRINT procedure.
proc cas; * Reference the CAS table and group by Model_Year *; casTbl = {name = "WARRANTY_CLAIMS", caslib = "casuser", groupby = "Model_Year"}; * Specify the output CAS table information *; outputTbl = {name = "yearByMake", caslib = "casuser"}; * Get a frequency of Model_Year by Make and store the results in a dictionary *; simple.freq result=freq_cr / table = casTbl, input = 'Make'; * Combine all the tables in the dictionary and create a result table *; freqTbl = combine_tables(freq_cr); * Save the result table as a SAS data set *; saveresult freqTbl dataout=work.yearByMake; quit; * Preview the SAS data set *; proc print data=work.yearByMake; run; |

The results above show the new SAS data set. Once you save the results of the CAS server as a SAS data set, you can use familiar SAS knowledge to continue processing the data on the compute server.
Plot the results of the freq action
Now, let's explore and visualize this data. You can use the SGPLOT procedure to visualize the summarized results from the CAS server that you saved as a SAS data set.
title height=14pt justify=left color=charcoal "Total Number of Warranty Claims by Model Year and Car Make"; title2 ""; proc sgplot data=work.yearByMake noborder; vline Model_Year / group = CharVar Response=Frequency markers; format Frequency comma16.; keylegend / position=topleft title='Car Makes'; label Frequency='Warranty Claims'; xaxis display=(nolabel); run; |
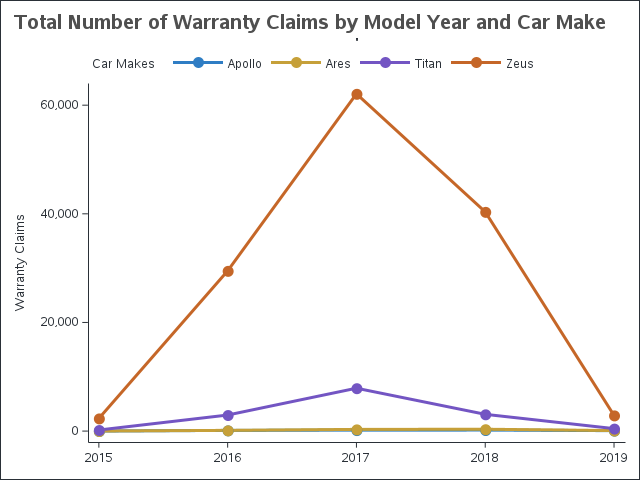
The visualization above shows the Zeus car Make is the primary cause of warranty claims in all years, and in the years 2016, 2017 and 2018 had a huge increase in warranty claims.
Summary
Using the groupBy sub parameter when referencing a CAS table enables you to easily group the results of a CAS action. When using the groupBy parameter:
- the action will return separate result tables for each distinct grouped value
- the casOut parameter in the action to creates a single CAS table with all the groups
- the COMBINE_TABLES function combines each distinct group by result table in the dictionary to create a single result table, and then saves that as a SAS data set
Additional resources
freq action
COMBINE_TABLES function
SAVERESULT statement
Plotting a Cloud Analytic Services (CAS) In-Memory Table
SAS® Cloud Analytic Services: CASL Programmer’s Guide
SAS® Cloud Analytic Services: Fundamentals
CAS Action! - a series on fundamentals
Getting Started with Python Integration to SAS® Viya® - Index