Welcome back to my SAS Users blog series CAS Action! - a series on fundamentals. If you'd like to start by learning more about the distributed CAS server and CAS actions, please see CAS Actions and Action Sets - a brief intro. Otherwise, let's learn how to generate frequency distributions for one or more columns using the simple.freq CAS action.
In this example, I will use the CAS language (CASL) to execute the freq CAS action. Be aware, instead of using CASL, I could execute the same action with Python, R and more with some slight changes to the syntax for the specific language. Refer to the documentation for syntax in other languages.
Load the demonstration data into memory
I'll start by executing the loadTable action to load the WARRANTY_CLAIMS_0117.sashdat file from the Samples caslib into memory. By default the Samples caslib should be available in your SAS Viya environment. I'll load the table to the Casuser caslib and then I'll clean up the CAS table by renaming and dropping columns to make the table easier to use. For more information how to rename columns check out my previous post. Lastly I'll execute the fetch action to preview 5 rows.
proc cas; * Specify the input/output CAS table *; casTbl = {name = "WARRANTY_CLAIMS", caslib = "casuser"}; * Load the CAS table into memory *; table.loadtable / path = "WARRANTY_CLAIMS_0117.sashdat", caslib = "samples", casOut = casTbl + {replace=TRUE}; * Rename columns with the labels. Spaces replaced with underscores *; *Store the results of the columnInfo action in a dictionary *; table.columnInfo result=cr / table = casTbl; * Loop over the columnInfo result table and create a list of dictionaries *; listElementCounter = 0; do columnMetadata over cr.ColumnInfo; listElementCounter = listElementCounter + 1; convertColLabel = tranwrd(columnMetadata['Label'],' ','_'); renameColumns[listElementCounter] = {name = columnMetadata['Column'], rename = convertColLabel, label=""}; end; * Rename columns *; keepColumns = {'Campaign_Type', 'Platform','Trim_Level','Make','Model_Year','Engine_Model', 'Vehicle_Assembly_Plant','Claim_Repair_Start_Date', 'Claim_Repair_End_Date'}; table.alterTable / name = casTbl['Name'], caslib = casTbl['caslib'], columns=renameColumns, keep = keepColumns; * Preview CAS table *; table.fetch / table = casTbl, to = 5; quit; |
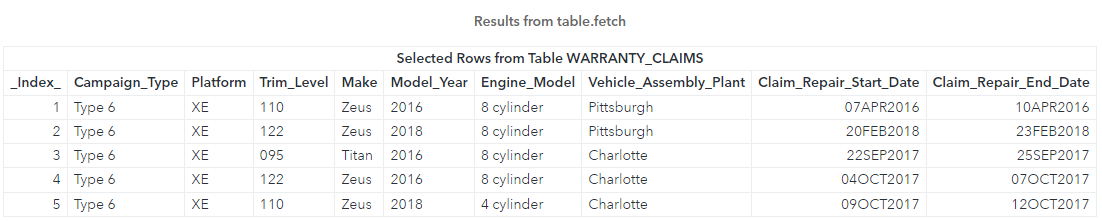
The results above show a preview of the warranty_claims CAS table.
One-way frequency table for a single column
To create a simple one-way frequency for a single column use the simple.freq CAS action. In the freq action, use the table parameter to specify the CAS table and the inputs parameter to specify the column to analyze. Here I'm using the warranty_claims CAS table and analyzing the Make column.
proc cas; casTbl = {name = "WARRANTY_CLAIMS", caslib = "casuser"}; simple.freq / table= casTbl, inputs = 'Make'; quit; |
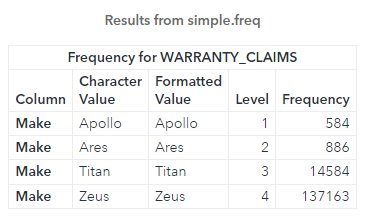
The freq action generates a simple one-way frequency table in the distributed CAS server and returns the results to the client. The results of the freq action include:
- the column that was analyzed in the Column column
- the distinct values for that column are shown in the Character Value column
- if a format is associated with that column it appears in the Formatted Value column; if no format exists, you see the same values
- the Frequency column represents the number of times that value occurs in the column
In the results above, we see the Zeus car make has the most warranty claims.
One-way frequency for multiple columns
To specify multiples columns in the freq action, add a list of columns to the inputs parameter. Here, I'll create a variable named colNames to store a list. In the list, I'll specify the Model_Year, Vehicle_Assembly_Plant and Engine_Model columns, and then use the variable in the inputs parameter.
proc cas; casTbl = {name = "WARRANTY_CLAIMS", caslib = "casuser"}; colNames = {'Model_Year', 'Vehicle_Assembly_Plant', 'Engine_Model'}; simple.freq / table= casTbl, inputs = colNames; quit; |

In the results above, we see the action returns a single result table with all three columns summarized. The column that was analyzed is shown in the Column column.
Apply a SAS format in the freq action
What if you want to apply a SAS date format to a column during analysis? For example, the Claim_Repair_Start_Date column contains a SAS date value with the DATE9 format. Instead of the detailed DATE9 format, what if I want to see the total number of repairs by year and quarter? Or by year? Or by year and month? You can easily apply a SAS format when using CAS actions.
Let's start by executing the freq CAS action on the Claim_Repair_Start_Date column.
proc cas; casTbl = {name = "WARRANTY_CLAIMS", caslib = "casuser"}; simple.freq / table= casTbl, inputs = 'Claim_Repair_Start_Date'; quit; |
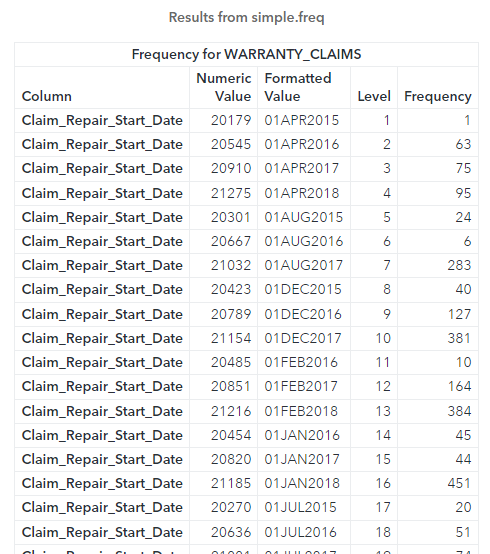
The results above show the action created a one way frequency of Claim_Repair_Start_Date using the DATE9 format and stored it in the CAS table. The Numeric Value column shows the raw SAS date values and the Formatted Value column shows the formatted dates.
Now, this analysis is too detailed. I don't want to see repairs by start date. Instead, I'll apply the YYQ format to summarize the dates by year and quarter. You can apply the format within the inputs parameter. In the inputs parameter specify a list of dictionaries. Here I'll use a single dictionary in the list and apply the YYQ format to the Claim_Repair_Start_Date column.
proc cas; casTbl = {name = "WARRANTY_CLAIMS", caslib = "casuser"}; simple.freq / table= casTbl, inputs = { {name = 'Claim_Repair_Start_Date', format = 'yyq.'} }; quit; |
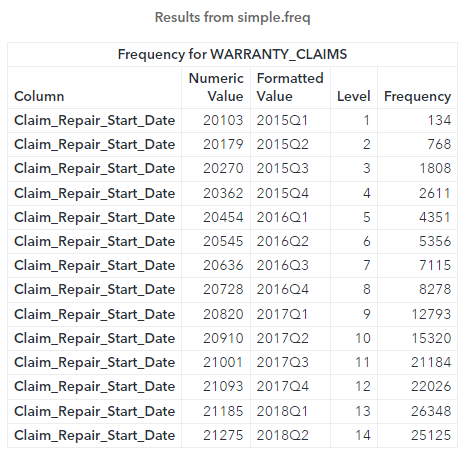
The results above display the frequency by year and quarter. The ability to apply a SAS format during execution enables us to quickly summarize data in a variety of ways.
Create a calculated column in the freq action
Lastly, you can also create calculated columns within an action for ad-hoc analysis. Here I'll create a new column named Make_Platform that concatenates the Make and Platform columns by specifying an expression in the variable calculateMakePlatform. Then I'll add the calculation to the computedVarsProgram parameter in my CAS table reference. Finally, I'll add the new column name to the inputs parameter in the freq action. For more information about creating calculated columns in a CAS table, check out my previous post.
proc cas; calculateMakePlatform = 'Make_Platform = catx("-",Make,Platform)'; casTbl = {name = "WARRANTY_CLAIMS", caslib = "casuser", computedVarsProgram = calculateMakePlatform}; simple.freq / table= casTbl, inputs = 'Make_Platform'; quit; |
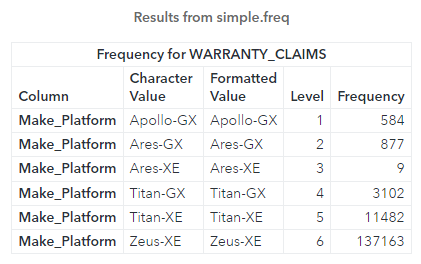
The results above show the Zeus-XE has the highest amount of warranty claims.
While viewing the results of the analysis is great, how can I work with these results? Maybe I want to create a visualization? What about creating another CAS table or SAS data set with these results? What about an Excel report? How can we do this? Well, stay tuned for part 2!
Summary
Using the freq CAS action enables you to generate a frequency distribution for one or more columns, apply SAS formats during analysis, and even create calculated columns. CAS actions are optimized to run in the distributed CAS server, are flexible, and can be executed in a variety of languages like Python and R!
Additional resources
freq action
SAS® Cloud Analytic Services: CASL Programmer’s Guide
CAS Action! - a series on fundamentals
Getting Started with Python Integration to SAS® Viya® - Index
SAS® Cloud Analytic Services: Fundamentals