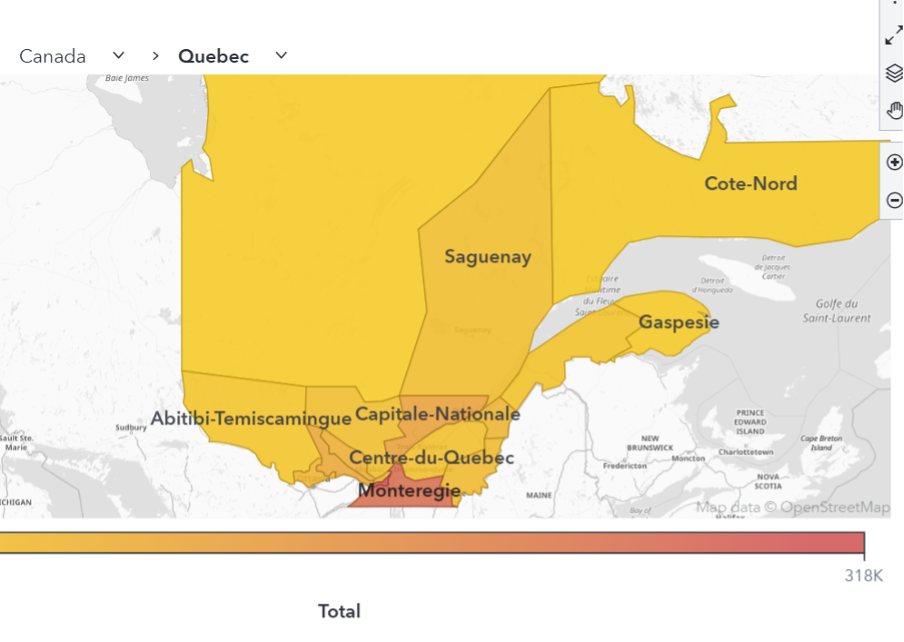
Learn how to create and visualize custom geographic regions in SAS Viya Visual Analytics, either by grouping existing map shapes or by uploading and configuring shapefiles to support regions with custom borders.
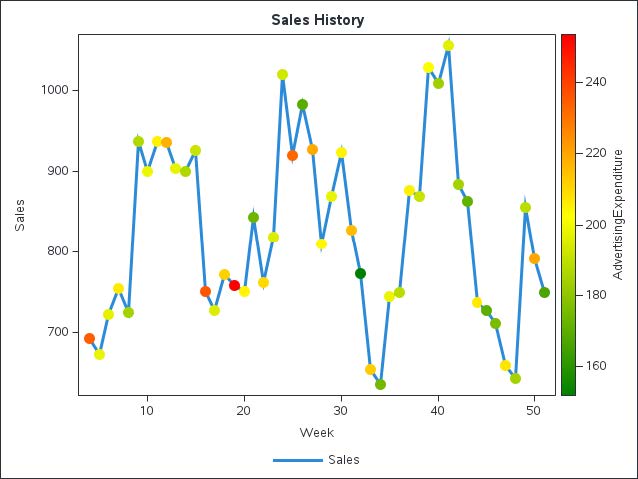

SAS's Kevin Scott explains how to set up and analyze a dataset for forecasting in SAS Viya with a particular emphasis on selecting lags for dynamic models
Fitting a Support Vector Machine (SVM) Model - Learn how to fit a support vector machine model and use your model to score new data In Part 6, Part 7, Part 9, Part 10, and Part 11 of this series, we fit a logistic regression, decision tree, random forest, gradient