In part 1 of this series, we examined our data before building any models. Among the discoveries was a column that seemed to contain a SAS date value. Here, we will discuss what exactly is meant by a 'SAS date', how to format it correctly, and how to create a new column using it.
What is a SAS Date?
In SAS, a date value is the count of days between January 1, 1960 and any specified day. Dates before that are reflected as negative numbers; after it's represented by positive numbers - for instance, 0 for January 1st, 1960; -365 for January 1st 1959 and 17532 for January 1, 2008.
Additionally, there's another way to represent dates in SAS - datetime values which signify how many seconds have elapsed from 1960 till an hour/minute/second on your chosen date.
For more information about SAS Date, Time and Datetime Values explore the SAS Documentation.
Load Data with a Date Format
In our last post, we noticed the APPDATE column had values in the 20,000 range.
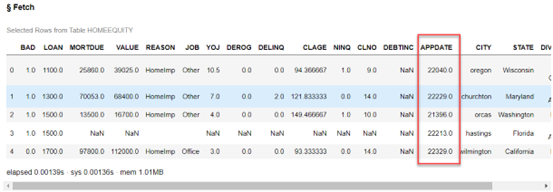
Being a seasoned SAS User made me aware that these values had the potential to be interpreted as date values when loaded. To further investigate, I applied a format and checked if they were indeed translated into relevant dates for this data set.
HomeEquity = conn.upload_file("https://support.sas.com/documentation/onlinedoc/viya/exampledatasets/home_equity.csv",
                     casOut={"name":"HomeEquity",
                             "caslib":"casuser",
                             "replace":True},
                     importoptions={"vars":{"APPDATE":{"format":"mmddyy10."}}
                     })
conn.table.fetch(table='HomeEquity', to=5, format=True)
To view the formatting related to this column, simply append "format=True" to our fetch statement.
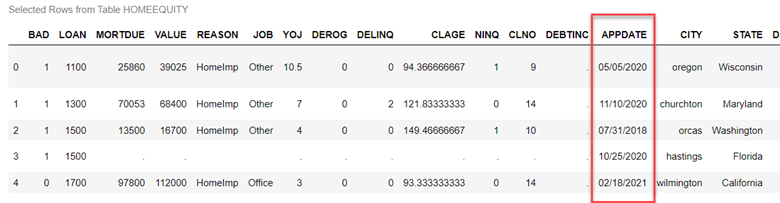
With the data being from the past 5 years, these dates seem to be accurate.
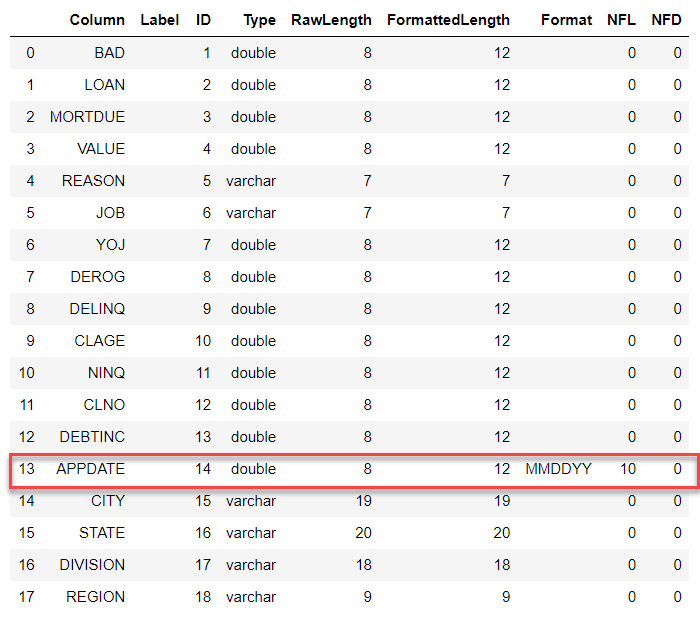
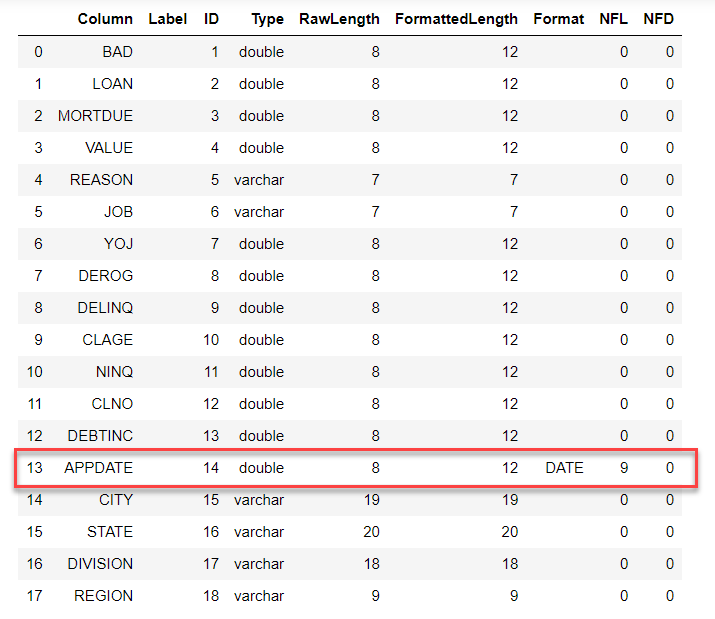
The column information data now indicates that MMDDYY is its designated format.
HomeEquity.table.columnInfo() |
Using the powerful SAS date format enables us to display data into various formats. For example, when reading the data with a DATE9. format, APPDATE will be presented as such. This is an invaluable benefit that makes working with dates much simpler and more efficient.
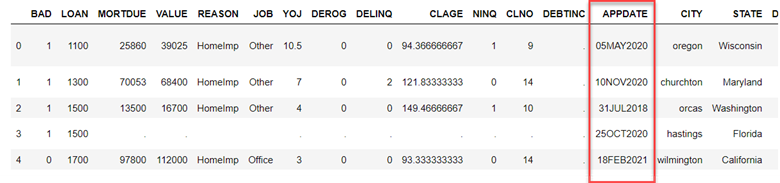
The format associated with APPDATE is also updated to reflect the DATE format.
Exploring Date Values
By leveraging SAS date values, we can quickly and easily create output based on the year, month or any other relevant categorization via straightforward Pandas syntax.
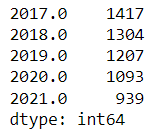
Utilize the dt and value_counts options of Pandas to conveniently obtain the number of rows per year.
HomeEquity.APPDATE.dt.year.value_counts() |
HomeEquity.shape |
(5950,18)
This data currently has 5,950 rows and 18 columns.
By utilizing the Pandas query string, we can filter our data by date.
filtered_tbl = HomeEquity.query("'2019-03-01'd <= APPDATE <= '2019-09-01'd") |
This selects a group of rows from our data that have an APPDATE between March 1, 2019 and September 1, 2019.
filtered_tbl.shape |
(610,18)
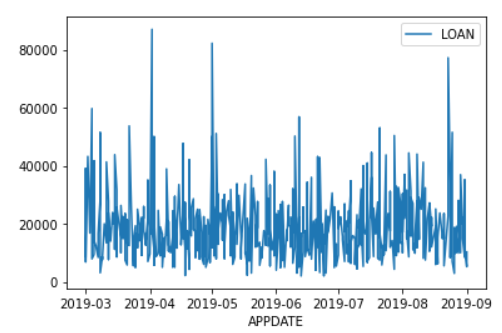
By trimming down the original 5,950 rows and 18 columns to 610 rows and 18 columns, we now have a dataset that is specifically tailored for creating a plot featuring our desired date value.
plt.figure().set_figwidth(15) filtered_tbl.plot(x="APPDATE", y="LOAN") plt.show() |
Create New Column from a Date Value
Dates are incredibly important, yet for our predictive modeling goals, we cannot simply use dates as inputs. Instead, we generate features or columns from the given date information - such as elapsed time or period between events. For instance, in regards to our dataset; the amount of days since application may prove to be an insightful metric!
If we had additional date values, we could introduce inputs such as the number of days since the last payment and the length of time that any payments were overdue. This type of data would be valuable for understanding customer behaviors related to payments.
As APPDATE is a SAS date value, expressed as the number of days since January 1, 1960, it allows us to use mathematical calculations or SAS numerical functions.
Using Basic Math Formulas
To figure out the days since an application date, subtract the two. In this example, let's calculate how many days have passed since an application for a loan using today's date - we can take advantage of SAS' TODAY() function to generate the appropriate SAS value for now.
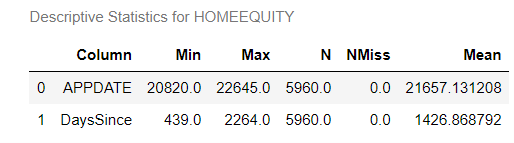
HomeEquity.eval('DaysSince = TODAY()-APPDATE') HomeEquity[['appdate','DaysSince']].summary(subSet=["N","NMISS","MEAN","MIN","MAX"]) |
To accurately calculate the amount of time elapsed from a particular date, we can use the formatted date shown below.
HomeEquity.eval("DaysSince2 = '31DEC2022'd - APPDATE") |
Using SAS Functions
To calculate the number of days between two dates, use SAS's DATDIF function in this format: DATDIF(startdate, enddate, basis).
By specifying a 'basis', you can control how days are counted. Utilizing this powerful date manipulation tool will ensure an accurate and easy-to-understand representation of elapsed time.
HomeEquity.eval("DaysSince3 = DATDIF(APPDATE, '31DEC2022'd, 'Actual')") |
With the Python head method, we can take a peek at our three freshly created columns.
HE_Dates= HomeEquity[["APPDATE", "DaysSince", "DaysSince2","DaysSince3"]] HE_Dates.head() |
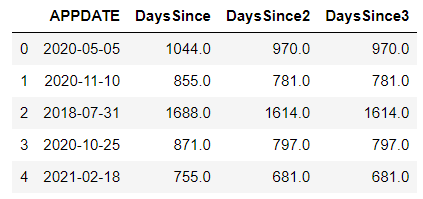
DaysSince was determined using the TODAY() function - March 15, 2023 at the time of writing this post - and for comparison purposes, DaysSince2 and DaysSince3 were both computed using December 31, 2022 for the end date.
The Wrap-Up: Working with Dates
In conclusion, working with dates in SAS is easy and efficient. Using the DYY format allows for different formats to be used and is an important consideration when reading data into SAS. Additionally, using Pandas syntax along with mathematical formulas or SAS functions make it possible to create new features from date values. This can be especially useful for creating elapsed time or time since an event. By taking advantage of the unique features of SAS dates, users can create meaningful insights from their data.
In the next post, we will learn how impute missing values in our data.