Did you know that about 8% of the world's men are colorblind? (More correctly, 8% of men are "color vision deficient," since they see colors, but not all colors.) Because of the "birthday paradox," in a room that contains eight men, the probability is 50% that at least one is colorblind. If you know 100 people, chances are very high (about 98.7%) that at least one friend is color vision deficient.
Consequently, if you are presenting graphs to a large audience, it is important to think about how your graphs might appear to those who are colorblind. This point was recently made in a well-written article by Sarah Kate Schuhler, a student at the NC State Institute for Advanced Analytics. Schuhler points out that there are various online tools, such as a Color Blindness Simulator (CoBliS) that you can use to see how one of your graphs will appear to a person who is colorblind.
This article runs some SAS graphs through the CoBliS simulator and gives tips on how to create graphs in that are interpretable by those who have color vision deficiency.
Run SAS graphs through a colorblindness simulator
For brevity, I will only look at the effect of deuteranopia, which is the most common type of color blindness. Deuteranopia is one form of "red-green color blindness" because people who have deuteranopia see green shades as red. (Another red-green color blindness is protanomaly, which makes red shades appear green.) There is a simple rule to make your graphs interpretable to people who have deuteranopia: Don't use red and green shades in the same graph if the colors are required to distinguish some elements (lines or markers) from others.
The next sections show several SAS graphs. Some are interpretable to someone who has deuteranopia, whereas others are not.
A colorblind-safe statistical graph
First, let's show an example of a graph that is interpretable to someone who has deuteranopia. A general rule is that the graph should not use a color ramp that includes both red and green. The following graph is from my 2022 article, "Use a heat map to visualize missing values in longitudinal data." I almost always use color palettes from the ColorBrewer web site (Brewer and Harrower, 2002). The ColorBrewer color ramps are supported in SAS by using the PALETTE function in SAS IML software. For the following heat map, the color ramp contains five colors. I used white as the lowest color of a color ramp and appended the colors for ColorBrewer's four-color "YlOrRd" (yellow-orange-red) color ramp.
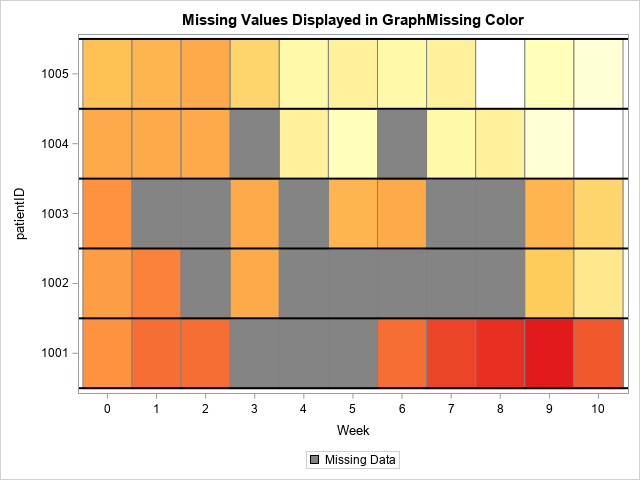
The image also uses a gray color to visualize missing values. Notice that this color ramp has reds and oranges, but no greens. Consequently, I expect it to be interpretable to someone who has deuteranopia. To see how the image would appear to someone who has deuteranopia, I uploaded the image to the CoBliS website. The result is shown below:
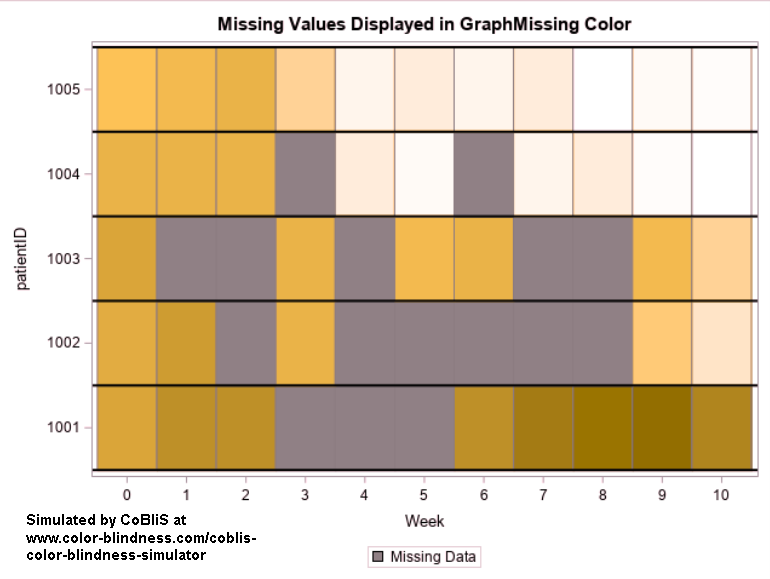
The deuteranopia image is different, even though the original image did not explicitly use any shade of green. Many colors (including gray) have a green component, and these colors look different to someone with deuteranopia. Overall, the reds and oranges in the image are shifted towards brown, and the bright colors are muted. Nevertheless, the graph is useful because the relative light and dark shades in the graph are distinguishable.
A graph that is not colorblind-safe
The simplest example of a SAS graph that is not colorblind-safe is a scatter plot or line plot that shows several groups, where each group is distinguished only by a color. If you are using the HTMLBlue ODS style, then the second group is colored brick red and the third group is colored forest green. Thus, the second and third groups might be indistinguishable to people with deuteranopia.
The following call to PROC SGPLOT in SAS creates a scatter plot of Fisher's Iris data in which each species of Iris is assigned a different color. The result is shown for the HTMLBlue style and for the ATTRPRIORITY=COLOR option, which tells SAS to use only colors to differentiate groups:
/* Using HTMLBlue ODS style */ ods graphics / AttrPriority=COLOR; title "Indicate Groups by Using Colors"; title2 "Use AttrPriority=COLOR"; proc sgplot data=sashelp.iris; scatter x=PetalWidth y=SepalWidth/ group=Species jitter markerattrs=(symbol=CircleFilled size=12); xaxis grid; yaxis grid; run; |
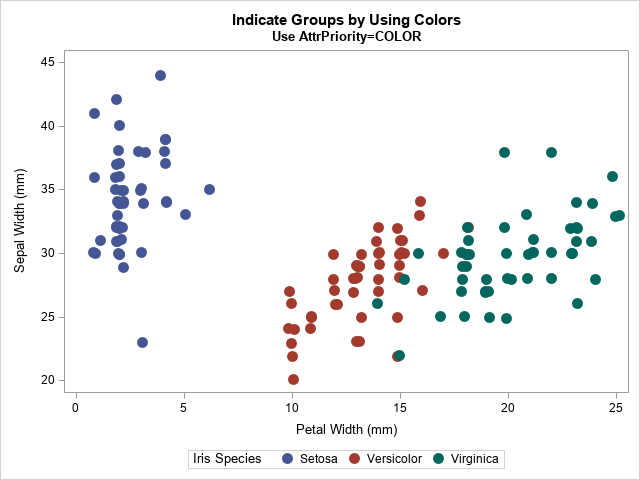
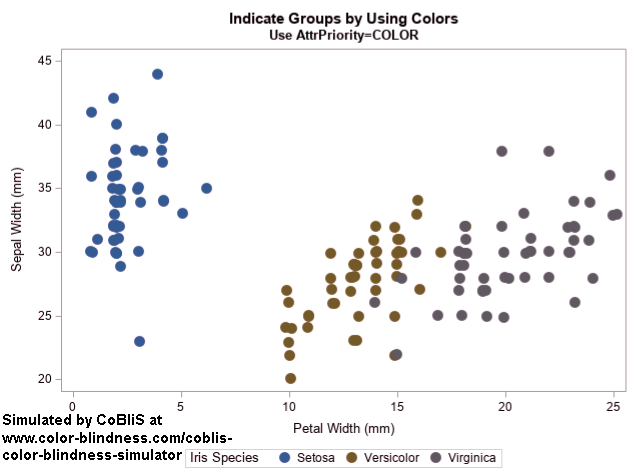
The output is shown for the original graph and for the same graph as seen by someone with deuteranopia. (Click to enlarge.) Because the graph uses only colors to distinguish groups and because the colors include both red and green, it is harder to distinguish between the Versicolor and Virginica species.
An easy solution is to use the ATTRPRIORITY=NONE option, which tells SAS to vary several attributes (colors, marker symbols, and line styles) when assigning attributes to graphical elements. The following SAS statements are essentially the same, except for the ATTRPRIORITY= option. I removed the call to set the symbol of markers so that the markers will vary among groups.
ods graphics / PUSH AttrPriority=NONE; title "Indicate Groups by Using Colors and Symbols"; title2 "Use AttrPriority=NONE"; proc sgplot data=sashelp.iris; scatter x=PetalWidth y=SepalWidth/ group=Species jitter markerattrs=(size=12); xaxis grid; yaxis grid; run; ods graphics / POP; |
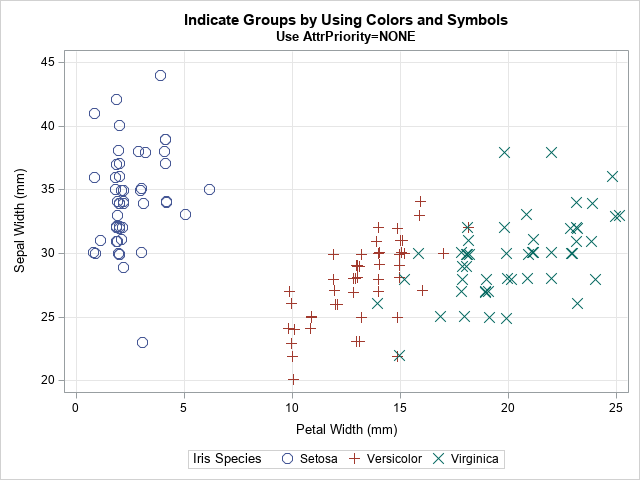
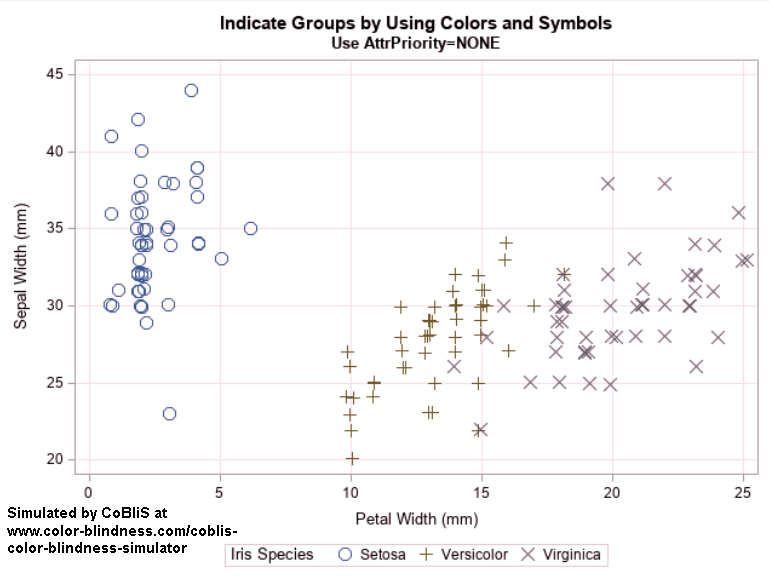
Although the colors are still difficult to distinguish if you have deuteranopia, the marker symbols make it clear which observations belong to which species.
The 'Daisy' ODS style
SAS has put a lot of effort into making sure that all output (tables and graphs) can be accessible to a wide range of users. The documentation section, "Creating Accessible Graphs," recommends several best practices for creating accessible graphs. Of these, I want to emphasize that there is an ODS style, called the 'Daisy' style, that is designed to maximize the interpretability of graphs for people with color vision deficiencies. If you run the previous example under the Daisy style, you get the following graph (on the left). I ran the graph through the CoBliS simulator so that you can see how it appears to someone with deuteranopia (on the right).
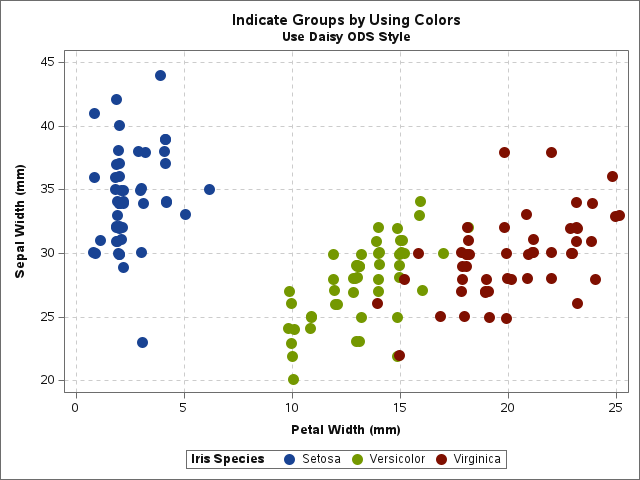
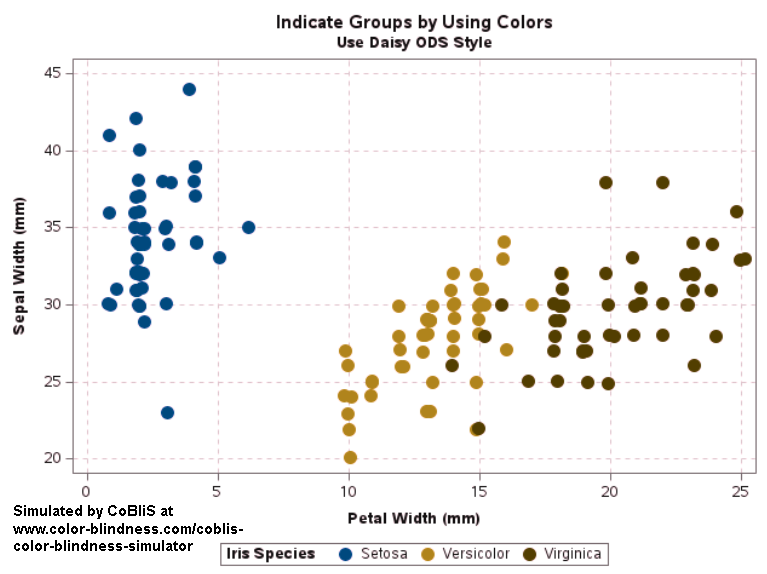
Although the olive-green color appears orange and the reddish color appears brown, the three colors are distinguishable to someone with deuteranopia.
Tips for making colorblind-safe statistical graphs
The following tips are simple and easy to follow, but can improve how well your graphs are perceived by people with color vision deficiencies:
- Avoid using colors in the same graph that colorblind people will be unable to distinguish. The most common deficiency is red-green, but some people are unable to distinguish blue-yellow.
- In SAS, use the ATTRPRIORITY=NONE option on the ODS GRAPHICS statement to ensure that non-color attributes (such as marker symbols and line styles) are used to encode group information.
- In SAS, use the Daisy ODS option, which cycles through colors that are more easily distinguished by people with color vision deficiencies.
- Avoid using a green-yellow-red palette for "traffic lighting" in dashboards. Or choose a "warm green," light yellow, and "cool red" so that the shades of the colors are distinguishable even if the colors are not.
This article is a brief introduction to making graphs accessible to everyone. The following references describe additional tips and best practices for creating accessible graphs in SAS:
- Summers, E., Langston, J., and Heath, D. (2018). "Accessibility and ODS Graphics: Seven Simple Steps to Section 508 Compliance Using SAS 9.4M5." Proceedings of the SAS Global Forum 2018 Conference.
- "Creating Accessible Graphs," in "Creating Accessible SAS Viya Platform Output Using ODS and ODS Graphics," documentation.

1 Comment
I have advocated against traffic lighting for color coding since 1995. So, I concur with the first part of your fourth tip. Of course, as you know, traffic lighting for color coding was misguidedly also used widely in tables and graphs, not just in dashboards.
Your suggestion "Or choose a "warm green," light yellow, and "cool red" so that the shades of the colors are distinguishable even if the colors are not." might be a feasible alternative, but not my preference.
First, a Side Note: It's best to avoid what I call "descriptively named colors". Excel color names and my eye-brain have disagreements. SAS color "Light Pink" is probably (decades later than I first saw this phenomenon) is still darker than Pink. The same was/is true of Light Violet and Violet, I believe. Traditional single-name colors like Red, Blue, Green, etc. are reliable--one hopes, in ANY software. A reliable solution is to choose a personal palette of the basics and supplement it with colors that you like with color codes that you know: RGB or HLS [or HSL in Microsoft Office] codes.
Since I can't paste in images here, you can find a display of my recommendations for Good versus Bad color-coding in Figure 2.1 in Chapter 2 (Principles of Communication-Effective Use of Color) of the book Visual Data Insights Using SAS ODS Graphics: A Guide to Communication-Effective Data Visualization.
For Very Good and Very Bad, I use full-strength colors, but lighter shades of the same for Good and Bad. For me, the middle color of the three or five in the palette can be white or non-dark Gray.
However, if one needs a "caution color" rather than a neutral color, then one might use Red, Orange, Blue or Orange, Yellow, Green for Bad, Caution, Good. Unless the context makes significance obvious, palettes like these, in my opinion, need to be explained via a legend or footnote.
I understand that ATTRPRIORITY=NONE is an interesting alternative way to make group variable value distinctions apparent, but I have a weakness for solid fill markers (usually circles) and solid lines. When they are color, their colors are more reliably apparent and distinguishable. (See my posting at LinkedIn "Make Color Graphs that People Can SEE".) Markers like + and X are not in my graphics design portfolio.
I think that the Daisy ODS option is marvelous, as long as one is indifferent as to the tool's color choices. I have been fussing over color choices since my first venture into SAS graphics in 1981.