Amazing things can be created when you start with small pieces and stack them together. Just ask Bryan Berg. He is the current world record holder for the tallest house of cards.
This same principle can be applied to the SGPLOT and SGPANEL procedures. You can take the individual plot types and stack them in a way that creates some very interesting and effective graphics.
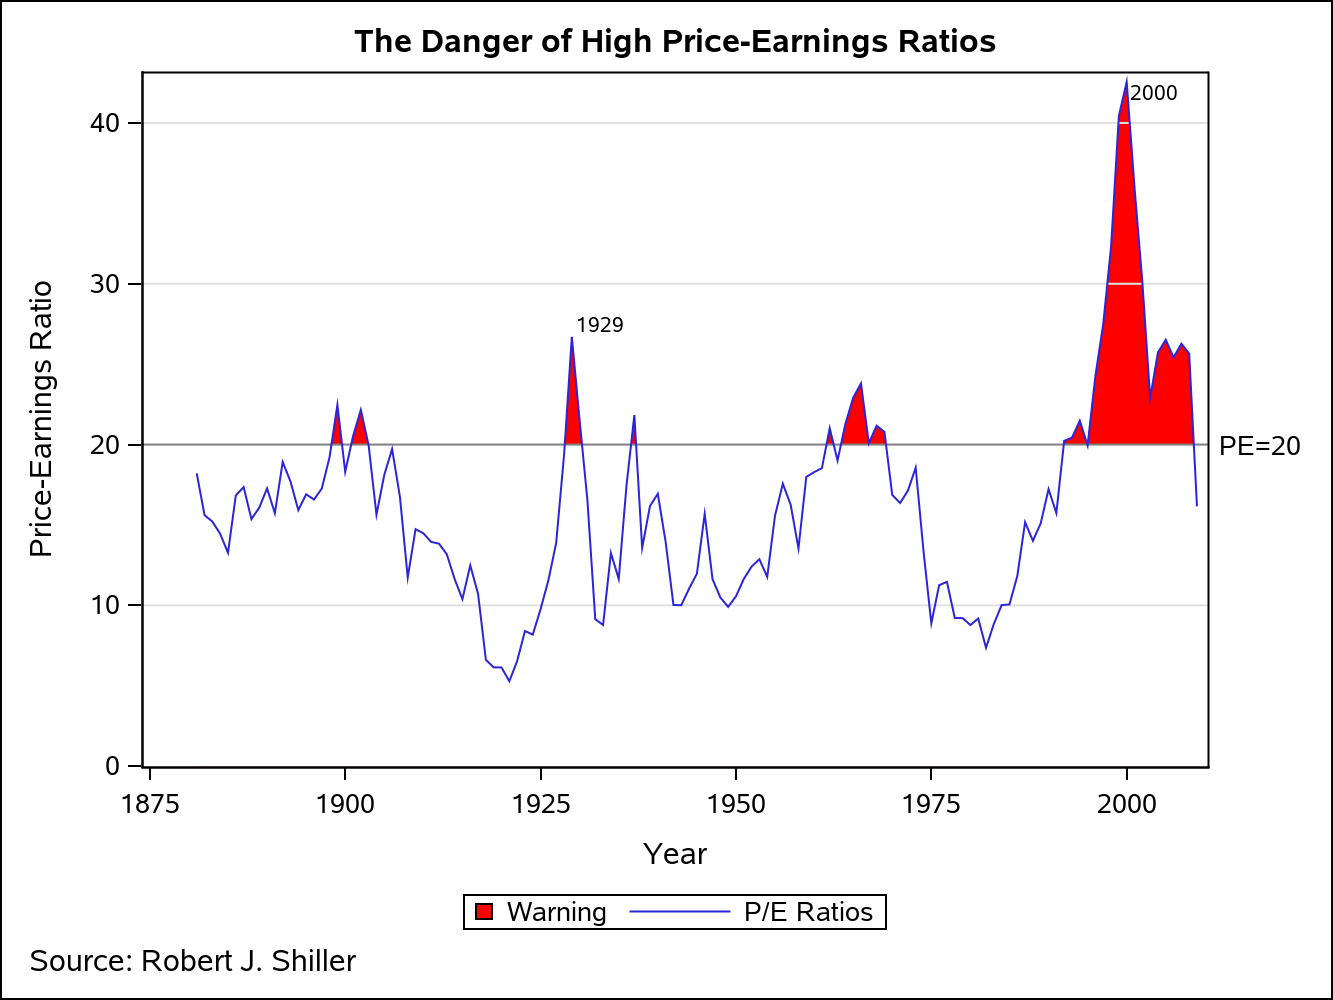
Consider the graph below. The SERIES plot is showing S&P 500 P/E ratios from 1981-2009. Whenever the ratio exceeds 20, the area under the iine is highlighted in red as a warning that stocks might be overvalued and could lead to a market correction. The question is, "How can you highlight the areas between the SERIES plot and the reference line at PE=20?"
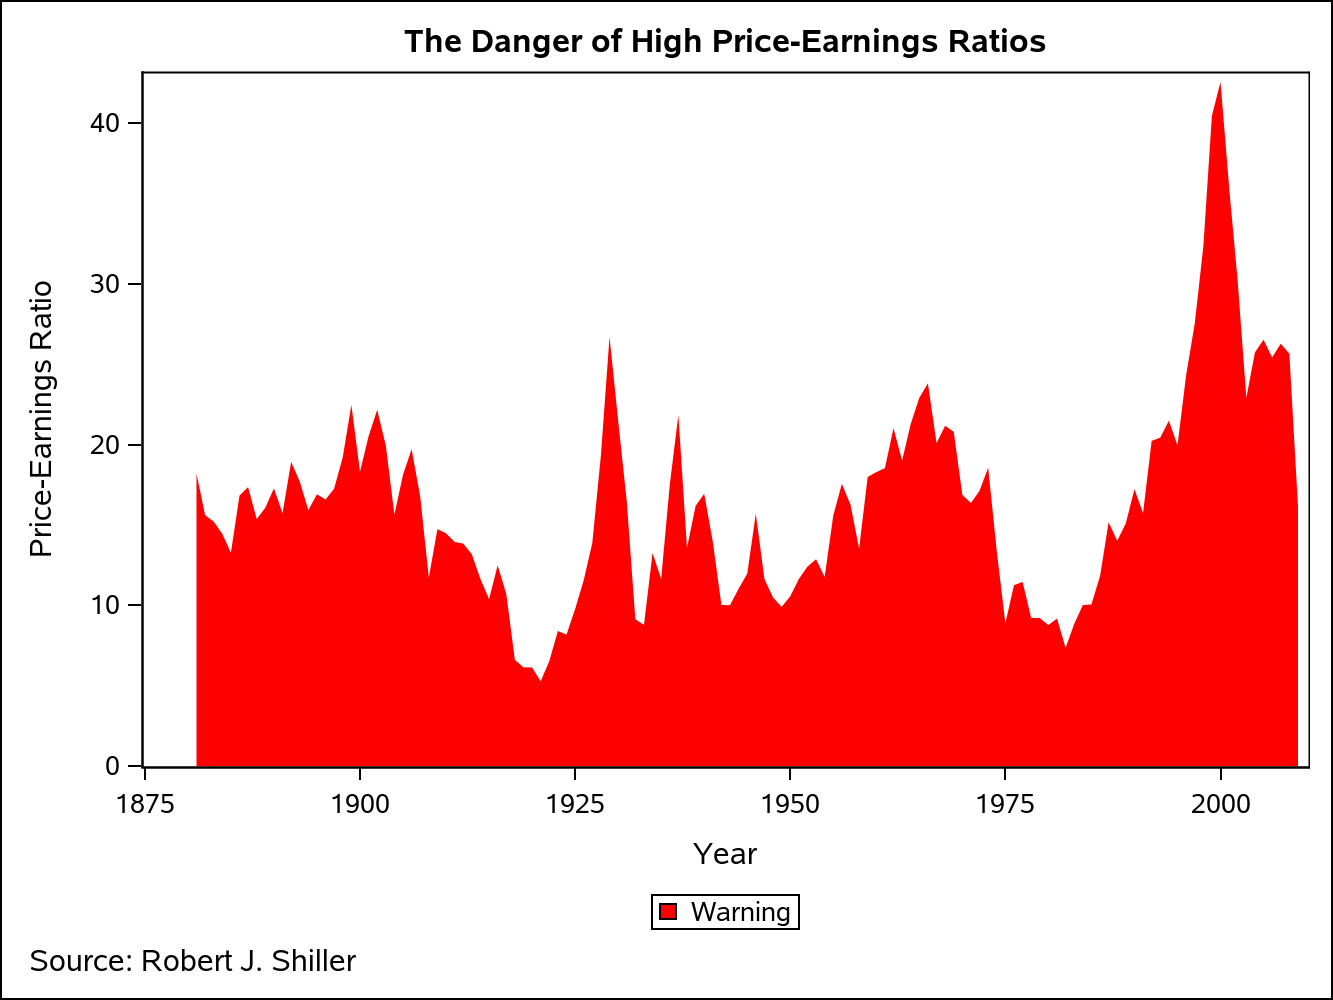
The secret is stacking the plots in a way that obscures part of the plot underneath. The best way to visualize this technique is to see the graph above rendered a piece at the time. The first step is to render the P/E data as an area plot. The way to do that in SGPLOT is to use a BAND plot, where the LOWER is set to a constant 0 and the UPPER is set to the column containing the data to be plotted.
Title "The Danger of High Price-Earnings Ratios"; Footnote j=left "Source: Robert J. Shiller"; proc sgplot data=pe_data; yaxis offsetmin=0; band X=Year upper=pe10 lower=0 / legendlabel="Warning" FillAttrs=GraphConfidence(Color=CXFF0000) name="Warning"; keylegend "Warning"; run; |
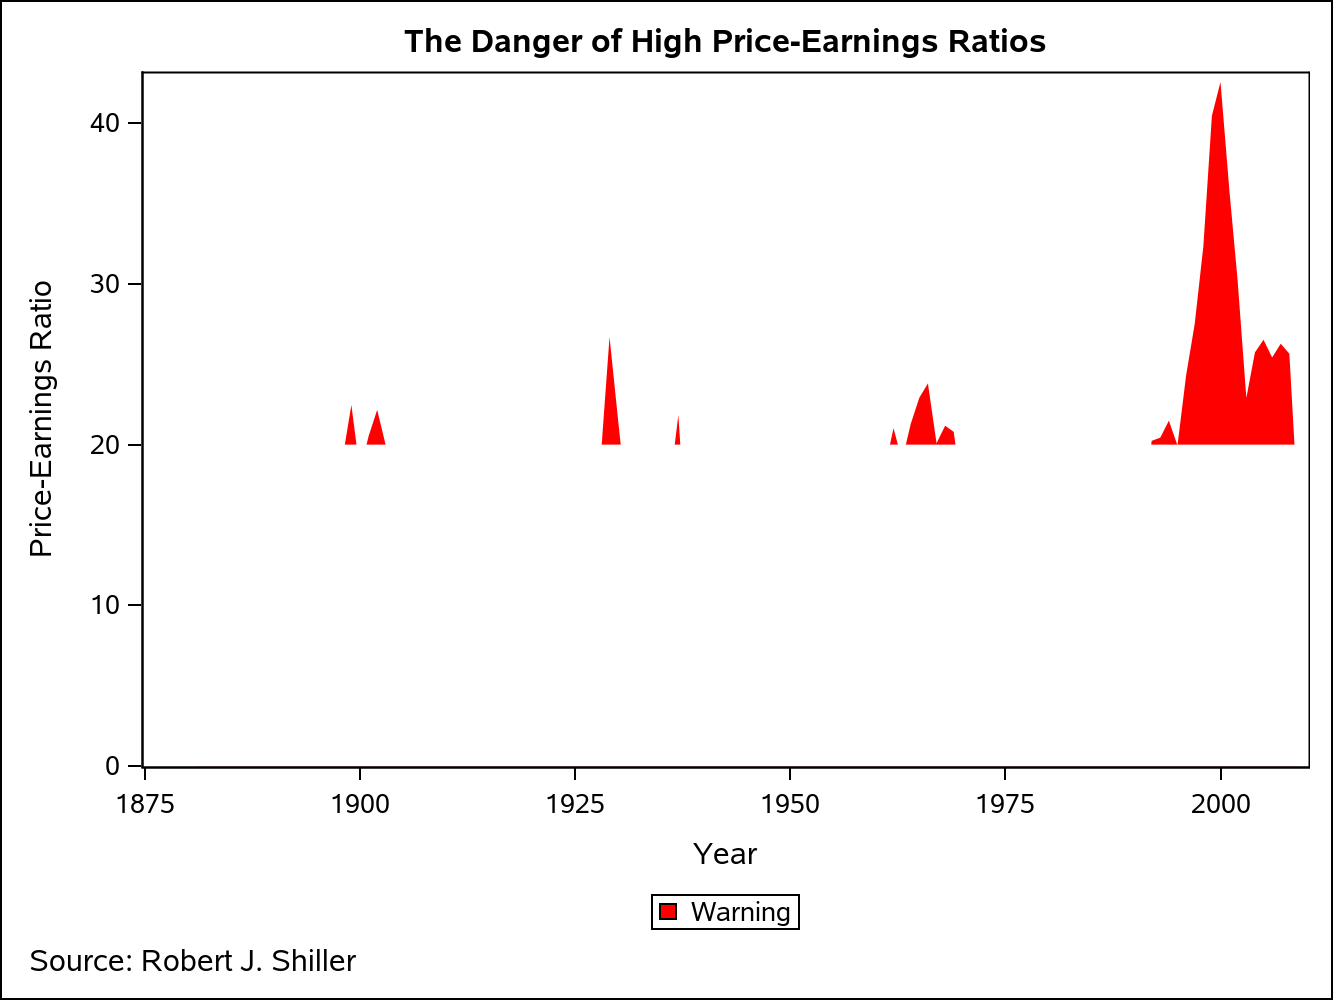
However, we want to see this area plot only where the P/E is greater than 20. To blot out the bottom part of the plot, I am going to use yet another BAND plot. This time, I am going to set the LOWER to have a constant value of 0 and the UPPER to have a constant value of 20. Also, I am setting the FILLATTRS to point to the GraphWalls style element. That way, the band color will match the wall color, regardless of the ODS style used.
proc sgplot data=pe_data; yaxis offsetmin=0; band X=Year upper=pe10 lower=0 / legendlabel="Warning" FillAttrs=GraphConfidence(Color=CXFF0000) name="Warning"; band X=Year Upper=20 Lower=0 / fillattrs=GraphWalls; keylegend "Warning"; run; |
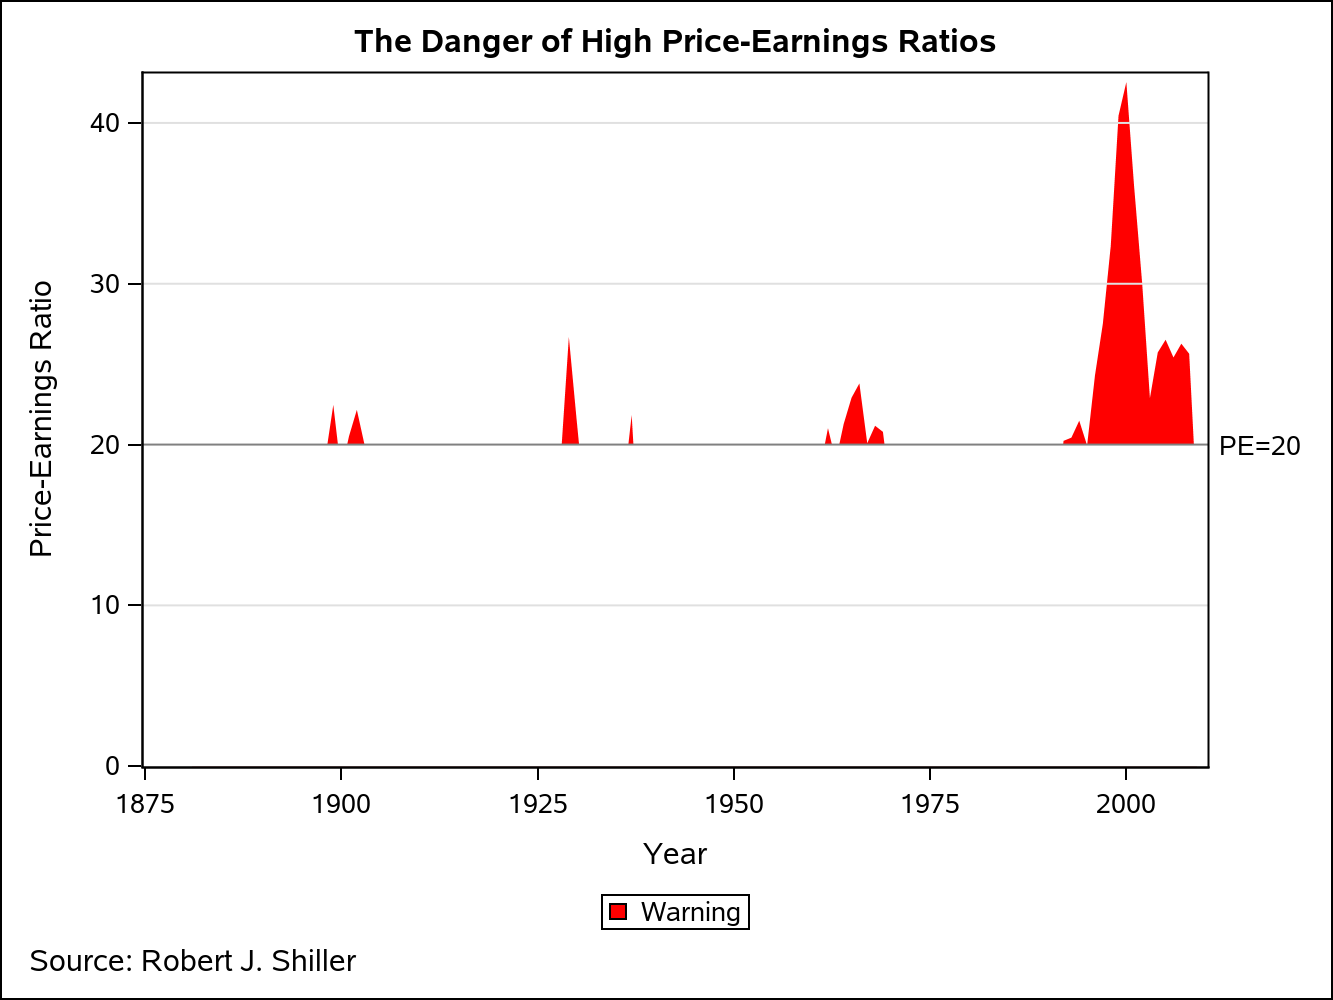
I want some grid lines on this plot, but I cannot use the GRID option on the axis statement, as that would put the grid lines behind the two BAND plots. The solution is to put REFLINEs on top of the bands, but style them like grid lines using the LINEATTRS option. I also added a normal reference line at PE=20.
proc sgplot data=pe_data; yaxis offsetmin=0; Band X=Year Upper=pe10 Lower=0 / legendlabel="Warning" FillAttrs=GraphConfidence(Color=CXFF0000) name="Warning"; Band X=Year Upper=20 Lower=0 / Fillattrs=GraphWalls; RefLine 10 30 40/ Lineattrs=GRAPHGRIDLINES; RefLine 20 / LABEL="PE=20"; keylegend "Warning"; run; |
Finally, I render the P/E data one more time on top of the other plots using a SERIES plot, completing the illusion that only the SERIES plot exceeding PE=20 is highlighted in red. Some data labels where also added to highlight a couple of important stock market events.
proc sgplot data=dan.pe_data; yaxis offsetmin=0; Band X=Year Upper=pe10 Lower=0 / legendlabel="Warning" FillAttrs=GraphConfidence(Color=CXFF0000) name="Warning"; Band X=Year Upper=20 Lower=0 / Fillattrs=GraphWalls; RefLine 10 30 40/ Lineattrs=GRAPHGRIDLINES; RefLine 20 / LABEL="PE=20"; Series X=Year Y=pe10 / Lineattrs=GRAPHDATA1 DataLabel=label NAME="SERIES" legendlabel="P/E Ratios"; keylegend "Warning" "SERIES"; run; |
Share Your Thoughts
Now that you have seen this technique in action, have you ever run into a situation where this would have been useful? Share your thoughts or comments below.